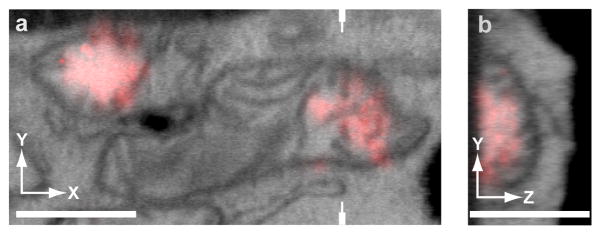
Figure 4.
Example 3D alignment of iPALM-FIB-SEM of thick cryosections. The scaling is adjusted so that fluorescence falls off at the same vertical location as the boundary of the section observed in the 3D EM data set. (a) x–y correlation, which is done using fiducial markers. (b) The y–z plane is cut through the volume, as indicated by the marks in a. A flat side in the fluorescence signal indicates the bottom plane of the section and can be used for alignment to the bottom of the section observed in the EM. The images can then be scaled so that the fluorescence falls within boundaries on the EM (i.e., the bottom edge of the section and the mitochondrial membrane). This feature-selection approach can be used for scaling and registration. Scale bars, 500 nm. Figure adapted from18.

