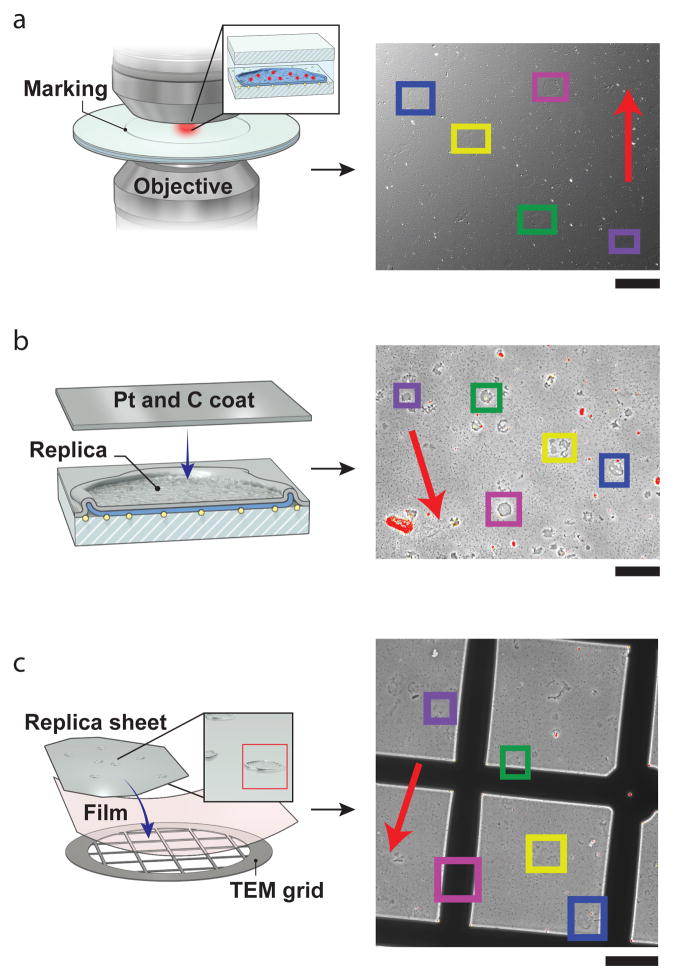
Figure 5.
Identifying imaged areas when using platinum replicas. (a) After fluorescence imaging, a 10× DIC map is used to find the cells imaged and a 4 mm circle is etched around the imaged region. (b) After coating the sample with platinum and carbon, 10× phase contrast of the circled region allows the cells to be re-found. (c) The replica is lifted onto a TEM grid where the cells should be found by comparing a 10× phase contrast image to the pre-lift phase contrast image of the replica. Images are snapshots taken to guide the correlative process (red pixels are saturated). The colored squares indicate cells that were imaged and located in all three steps. Red arrows indicate the changing orientation of the cellular landscape during each step. Adapted from22. Scale bars = 100 μm.

