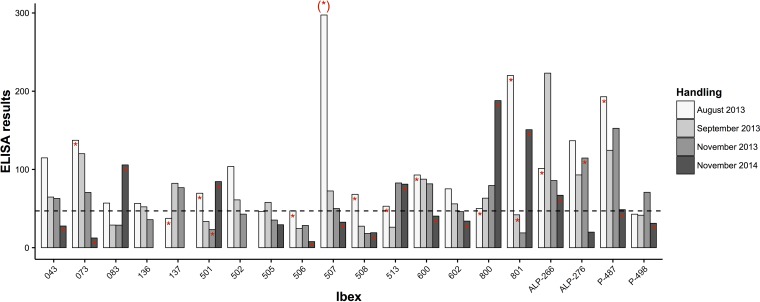
FIG 4.
Bar graph showing individual trends of the ELISA results from a random selection of ibexes that were sampled in most of the handlings in 2013 during the IKC outbreak and in 2014 with mostly asymptomatic infections. Numbers on the x axis are the individual ibex reference, and the ELISA results on the y axis correspond to the relative percentage from the positive reference standard. The detection of M. conjunctivae in eye swabs is shown with a red asterisk in the top of the bars, and the cutoff for seropositivity is shown with a horizontal dashed line. The asterisk in parentheses above the bar for ibex 507 indicates that it corresponds to a previous sampling in July 2013.

