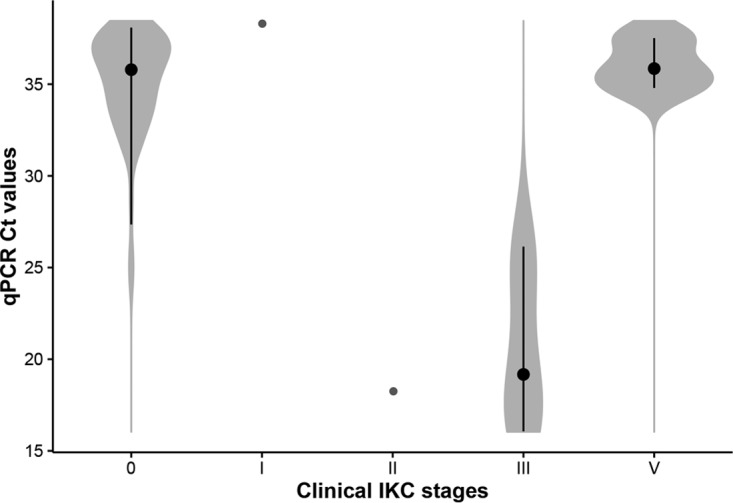
FIG 5.

Violin plot showing the distribution of the CT values in eye swabs in IKC clinical stages that were qPCR positive. CT values were significantly lower in severe IKC stages (II and III) than initial (I) and healing stages (V) and asymptomatic infections (0). Black bars show the interquartile range, and black dots indicate the median of the CT values for each group.
