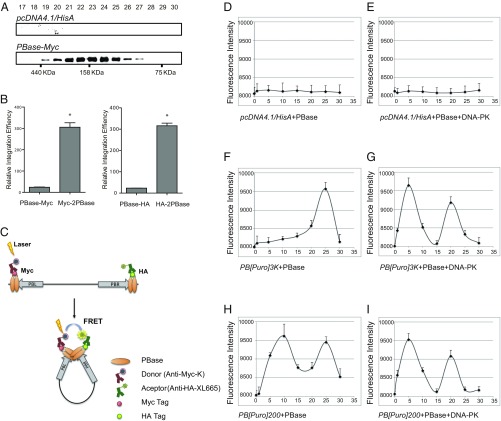
Fig. 4.
DNA–PK contributes to PEC formation of PB. (A) PBase forms dimers in cell lysate. Western blots of gel-filtration fractions are shown. HEK293T lysates were expressed with either PBase-Myc or the empty vector control. Fraction numbers are indicated. (B) The activity of dimer-PBases (Myc-2PBase or HA-2PBase) in 293T cells. Relative integration efficiency was normalized with the expression of PBase or dimer-PBase (Fig. S2). *P < 0.01. (C) Schematic diagram of FRET expected upon PEC formation. (D–I) FRET signals detected upon PEC formation. Time courses of FRET were recorded when PBase was incubated with different PB constructs (Fig. 5A) without (D, F, and H) or with DNA–PK (E, G, and I). The plasmid pcDNA4.1/HisA was used as negative control. Error bars were plotted by the standard error of the mean (SEM).

