Fig. S2.
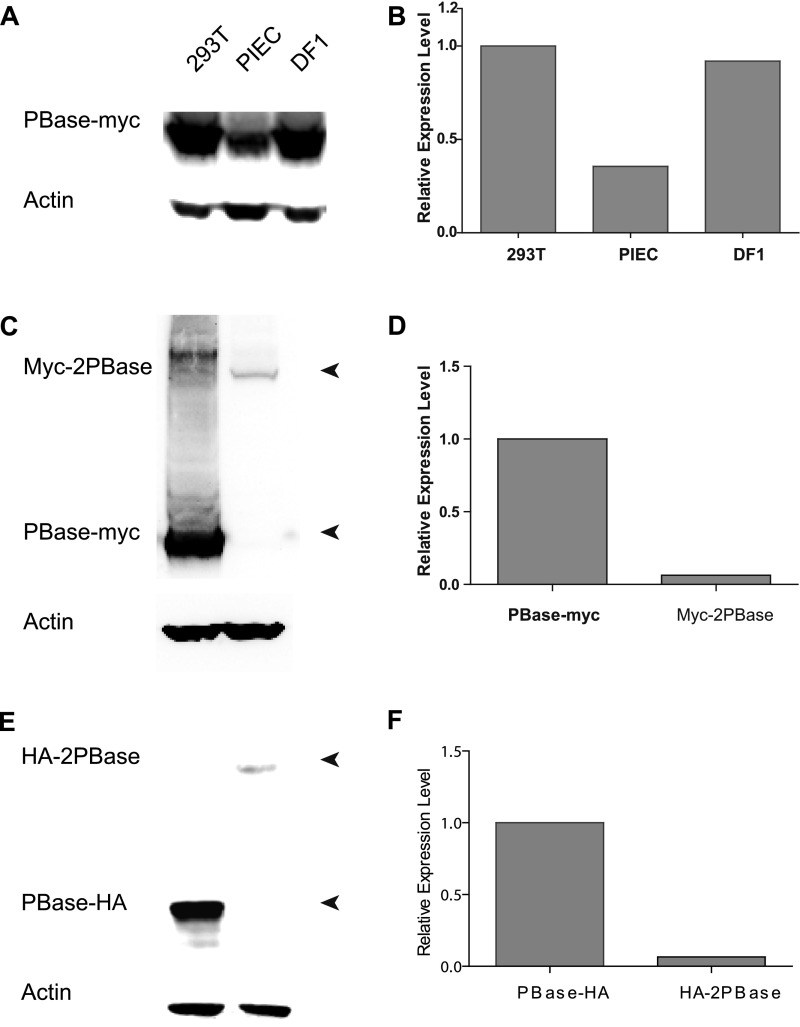
PBase expression in cultured cells. (A) Western blots of PBase in different cultured cells are shown. (B) PBase relative expression levels in different cultured cells normalized by the expression of Actb are shown. (C) Western blots of PBase (PBase-Myc) and dimer-PBase (Myc-2PBase) are shown. (D) PBase-Myc and Myc-2PBase relative expression levels normalized by the expression of Actb are shown. (E) Western blots of PBase (PBase-HA) and dimer-PBase (HA-2PBase) are shown. (F) PBase-HA and HA-2PBase relative expression levels normalized by the expression of Actb are shown.

