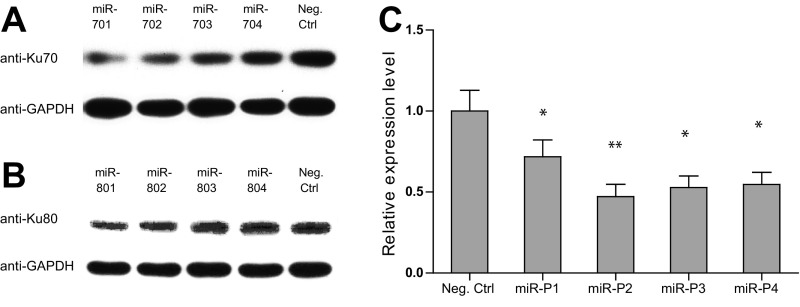
Fig. S3.
Evaluation of RNAi constructs of DNA–PK components in HEK293T cells. Western blots of Ku70 and Ku80 are shown in A and B, respectively. Real-time RT-PCR results normalized by the expression of Actb are shown for DNA-PKcs in C. *P < 0.05, **P < 0.01. Error bars were plotted by the standard error of the mean (SEM).

