Fig. 5.
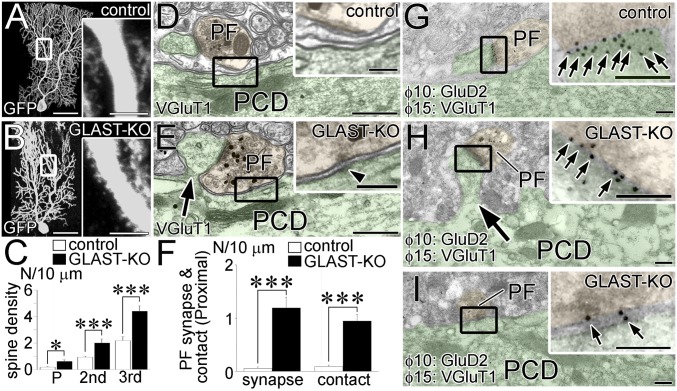
Excess PF wiring. Images from control (A, D, and G) and mutant (B, E, H, and I) mice. Boxed regions are enlarged in Insets. PCDs and PF terminals are pseudocolored in green and yellow, respectively. (A and B) GFP-transfected PCs. (C) The density of spines per 10 µm of the primary, secondary, and tertiary dendrites. The total measured lengths (mm) of the primary, secondary, and tertiary dendrites are 0.59, 3.93, and 1.51 in control mice and 0.60, 1.42, and 1.71 in mutant mice, respectively. (D and E) Preembedding immunogold for VGluT1, a marker for PF terminals. (F) The density of PF synapses (Left) and direct PF contacts (Right) per 10 µm of proximal shaft dendrites (>2 µm in caliber). The total measured lengths (μm) are 933.6 and 517.4 in control and mutant mice, respectively. *P < 0.05; ***P < 0.001, Mann–Whitney U test. Error bars represent SEM. (G–I) Postembedding immunogold labeling for GluD2 (ϕ = 10 nm, small arrows) and VGluT1 (ϕ = 15 nm). (Scale bars: A and B, 50 µm; Inset in A and B, 10 µm; D and E, 500 nm; G–I, 200 nm; Insets in D, E, and G–I, 100 nm.)

