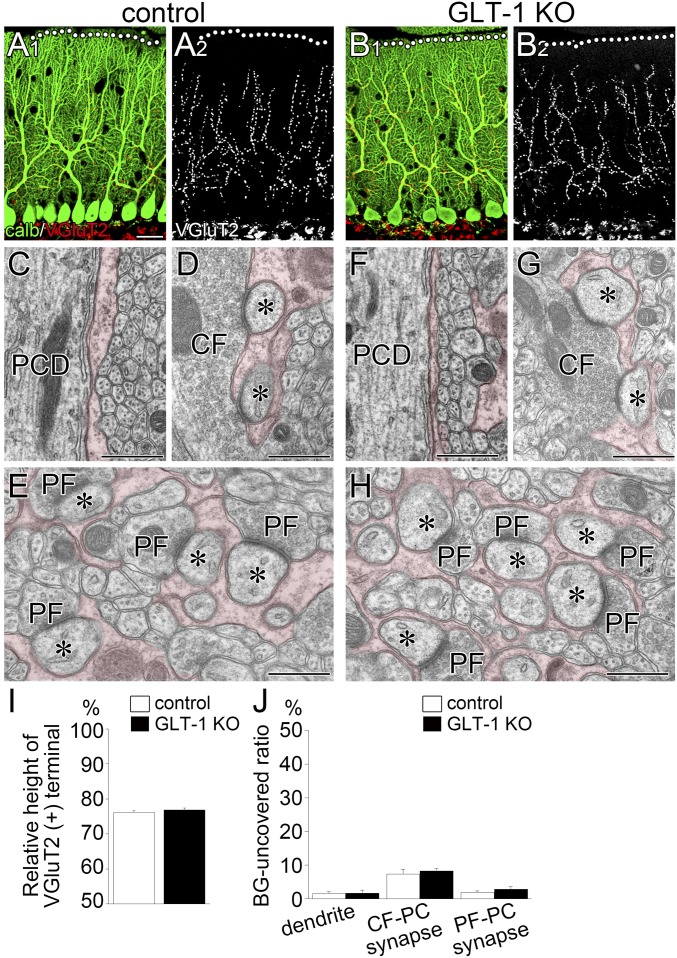
Fig. S9.
Normal dendritic translocation by CFs and normal BG wrapping of PC dendrites and synapses in GLT1-KO mice at P21. (A and B) Double immunofluorescence for calbindin (green) and VGluT2 (red or gray) in control (A) and GLT-KO (B) mice. (C–H) Electron micrographs of PCDs (C and F), CF–PC synapses (D and G) and PF–PC synapses (E and H) surrounded by BG processes (pseudocolored in red) in control (C–E) and GLT-1 KO mice (F–H). Dendritic surface and synaptic edges are normally covered by BG processes in GLT1-KO mice. Asterisks indicate PC spines contacting CF or PF terminals. (I) Histogram showing normal vertical height of VGluT2(+) CF terminals relative to the molecular layer thickness in GLT1-KO mice: 76.2 ± 0.5% in control (n = 129) and 76.9 ± 0.5% in GLT-1 KO (n = 180) mice; P = 0.2591, Mann–Whitney U test. (J) Histograms showing normal BG coverage of proximal shaft dendrites (Left; P = 0.2330, Mann–Whitney U test), CF–PC synaptic edge (Middle; P = 0.6579), and PF–PC synaptic edge (Right; P = 0.2752) in GLT1-KO mice. The total measured lengths of the dendritic membrane are 424.5 and 380.0 μm in control and GLT-1 KO mice, respectively. The total numbers of the synaptic edge are 86 and 118 for CF–PC synapses, and 396 and 350 for PF–PC synapses in control and mutant mice, respectively. Error bars represent SEM. (Scale bars: A, 20 µm; C–H, 500 nm.)

