Fig. S1.
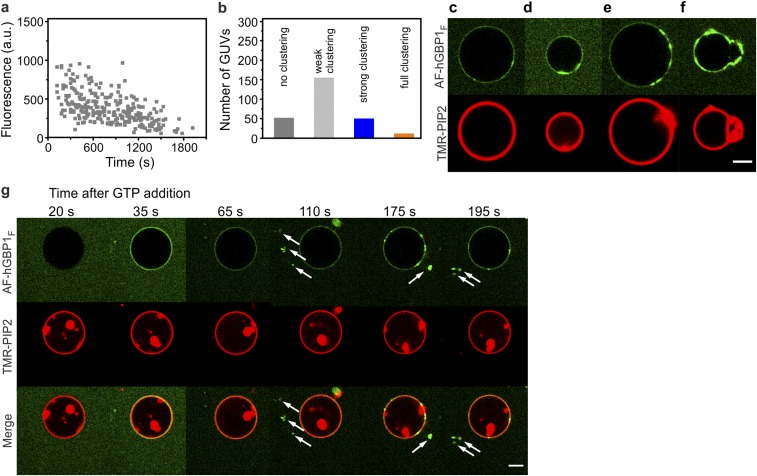
Binding of AF-hGBP1F to GUVs in the presence of GTP. (A) Referred to as the GUV pool, all GUVs in the chamber were screened one after another within a time slot of about 30 min. The experiment was started by addition of 1 mM GTP (t = 0 s) into 2.5 µM AF-hGBP1F premixed with GUVs. Time-dependent protein fluorescence was evaluated in homogeneous surface regions of GUVs. (B) Statistics of GUV phenotypes (as depicted in C–F) identified upon GTP-induced binding of AF-hGBP1F to a pool of vesicles. Representative images of AF-hGBP1F-covered GUVs illustrate four different phenotypes: (C) Homogeneous distribution of the protein on the GUV surface, protein amount within clusters was less than 5%. This phenotype accounted for ∼70% of all GUVs. (D) Weak clustering, protein amount within clusters was either tiny or it covered not more than 25% of GUV’s surface. (E) Strong clustering, clusters of AF-hGBP1F covered between 25% and 75% of GUV’s surface, and (F) full clustering, most of GUVs’ surface (>75%) was covered with protein clusters. (Scale bar, 5 µm.) (G) Time lapse of GTP-induced AF-hGBP1F binding to GUVs showed that initial binding was followed by a drop of background fluorescence and appearance of floating protein clusters (only visible in the protein channel of fluorescence and indicated with white arrows). (Scale bar, 5 µm.) a.u., arbitrary units.

