Fig. 3.
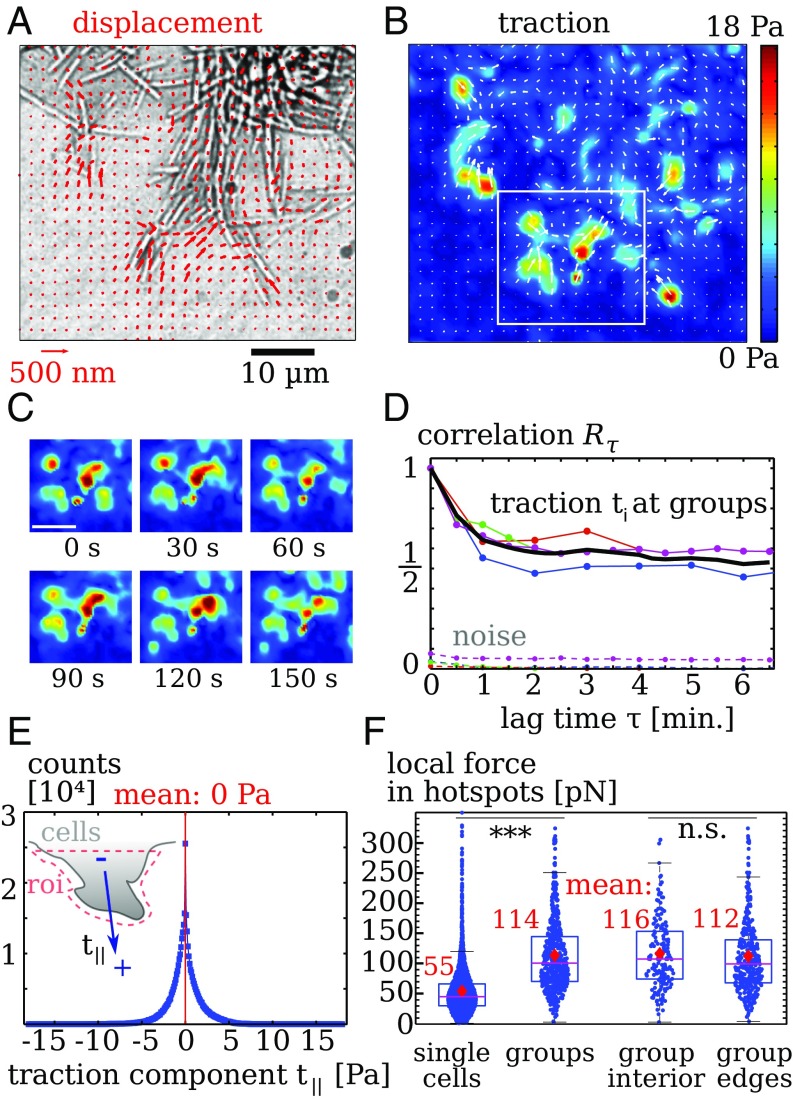
Collective migration of twitching bacteria that are gliding-deficient (aglQ). (A) Gel displacements. Only every fourth measurement is displayed for clearer visibility. (B) Calculated traction showing hotspots. (C) Snapshots displaying evolution of of the traction pattern inside the region denoted by a white rectangle in B. (Scale bar: .) (D) The autocorrelation quantifies temporal fluctuations of traction. Upper lines denote data below cell groups and mean (black line). Lower, dotted lines denote traction noise measured in regions without cells. (E, Inset) Distribution of the traction component resulting from projection of on the main normal axis of an edge in a region of interest (roi). Data points: Tractions have a vanishing mean, showing that cell–substrate forces balance locally. Bin width is . (F) Force magnitude of hotspots. Single twitching cells produce significantly weaker hotspots than groups. In groups, forces at the edge are comparable to those measured below the cells. Dots are individual measurements. Stars indicate significantly different distributions with in a rank sum test. Data for cell groups in D and E were collected from four separate experiments with an overall of images taken at frame rates of 30 to 60 s.

