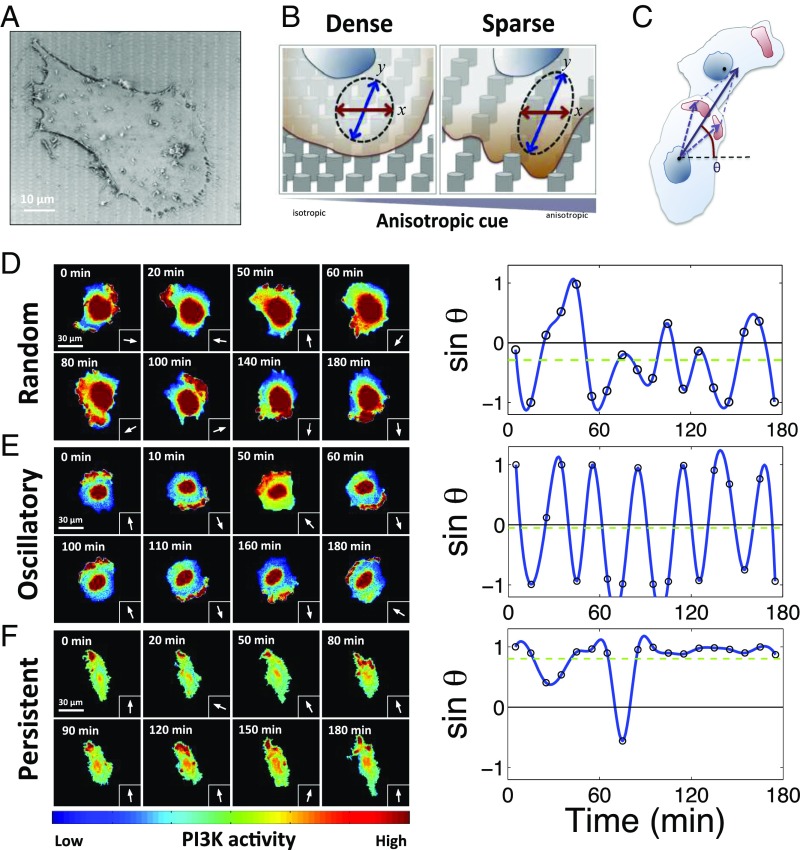
Fig. 1.
A melanoma cell population displays three coexistent polarity patterns whose relative abundance is modulated by the topography of the cell adhesion substratum. (A) A scanning electron microscopy image of a 1205Lu (aggressive melanoma cell line) cell cultured on fibronectin (FN)-precoated post arrays. (B) Schematic of a single 1205Lu cell sensing anisotropic topographic cues from the nanofabricated graded density post array substrata. In the dense post region (Left), the nanopost density is equal in x and y directions, whereas, in the sparse post region, where penetration between posts of cells results in greater contact with the substratum adhesion, the substratum anisotropy is the greatest due to a much larger spacing in the x but not y direction. (C) The angle of a signaling vector (θ) of an individual cell is defined as the direction from its centroid to the sum of centroids of its hot spots of PI3K activity with respect to the x direction. Details are described in Materials and Methods. (D–F) Three dynamic patterns of cell polarity seen in sequential images of PI3K activation and indicated by the signaling vector defined in C in three representative cells. Representative pseudocolor images of elevated spatial PI3K activation (color scale at the Bottom) (left panels) and sinθ(t) at each time point (arrows) (right panels), with the indicated time resolution; (D) the random polarity pattern, (E) the oscillatory polarity pattern, and (F) the persistent polarity pattern.

