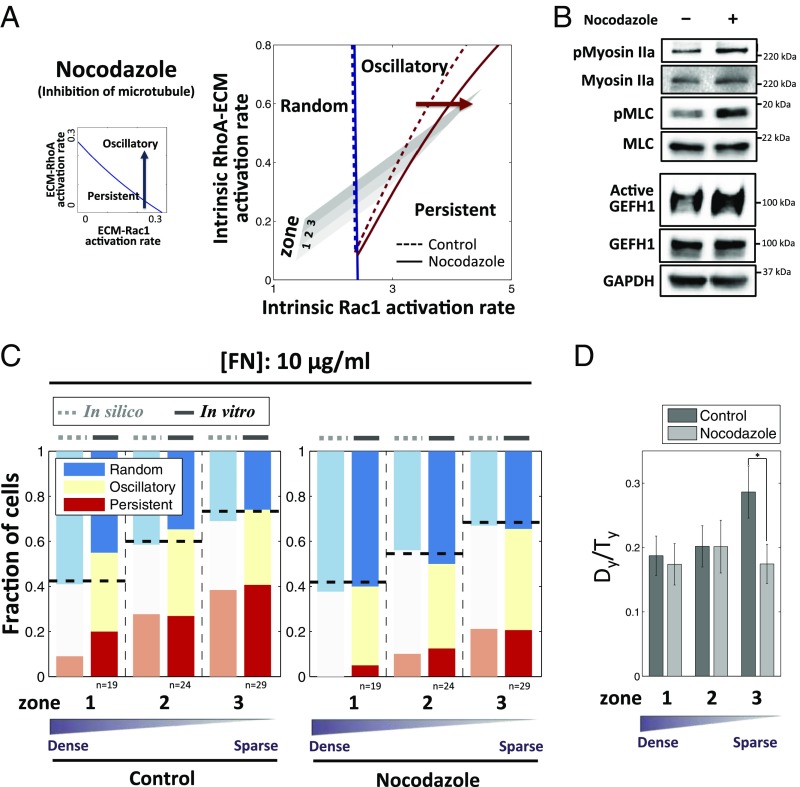
Fig. 4.
Effect of pharmacological perturbation of microtubule dynamics on dynamic cell polarity patterns. (A, Left) Blue arrow depicts increasing RhoA–ROCK activity by microtubule inhibition, which biases cells toward oscillatory dynamics. (Right) Microtubule inhibition shifts the boundary between oscillatory and persistent regime to the right, decreasing the persistent regime and hence the fraction of cells exhibiting persistent dynamics. (B) Microtubule inhibition increases RhoA–ROCK activity as measured by immunoblotting of phosphorylated Myosin IIa/Myosin IIa and phosphorylated MLC/MLC, which potentially results from higher activation of GEF-H1, a RhoGEF whose activity is affected by nocodazole (Materials and Methods, Active Rho GTPase Exchange Factor Assay). (C) Comparison of model (in silico) and experiment (in vitro) results for the dependence of PI3K dynamics on post density with 10 μg/mL FN after microtubule inhibition. (D) Dependence of the ratio Dy/Ty for 1 h on post density substrata and nocodazole: Inhibition of microtubule reduces the persistence of cell migration. *P < 0.05 for Dy/Ty values in each group using all paired Student’s t test.

