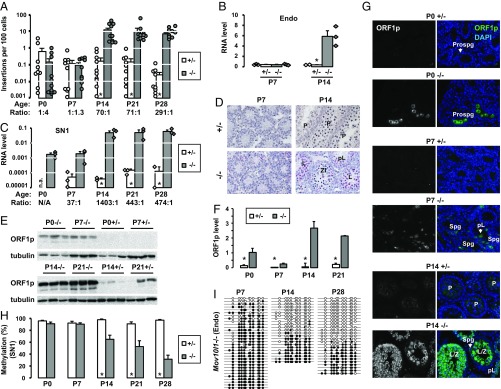
Fig. 3.
Characterization of the single-copy 5′UTR-ORFeus transgene in prepuberal testes. (A) Insertion frequency of the transgene in prepuberal Mov10l1+/− and Mov10l1−/− testes. The age of the animals and the insertion ratio of Mov10l1−/− to Mov10l1+/− are indicated on the x axis. ddPCR readouts for individual animals are indicated (circles). Error bars represent SEM for biological replicates. Asterisks indicate statistical difference between two genotypes (Mann–Whitney U test, P < 0.05). (B) Endogenous L1 RNA in prepuberal Mov10l1+/− and Mov10l1−/− testes. Normalized to Gapdh RNA abundance. Values for individual animals are indicated (diamonds). (C) SN1 transgene RNA in prepuberal Mov10l1+/− and Mov10l1−/− testes. The RNA ratio of Mov10l1−/− to Mov10l1+/− is annotated for each age group. Error bars in B and C represent SEM for biological replicates. Asterisks indicate statistical difference between two genotypes (Student’s t test, P < 0.05). N.A., not assayed. (D) Transgene RNA expression in prepuberal Mov10l1+/− and Mov10l1−/− testes analyzed by RNAscope. RNA targets were detected as discrete red foci. Nuclei were counterstained with Gill’s hematoxylin in blue. L, leptotene; P, pachytene; pL, preleptotene; Zl, zygotene-like. (Magnification: 20×.) (E) Western blot analysis of ORF1p in prepuberal Mov10l1+/− and Mov10l1−/− testes. (F) Quantification of ORF1p in E. Normalized to α-tubulin. Error bars represent SEM for biological replicates. Asterisks indicate statistical difference between two genotypes (Student’s t test, P < 0.05). (G) Immunofluorescence staining of ORF1p in prepuberal Mov10l1+/− and Mov10l1−/− testicular cross sections. P, pachytene; pL, preleptotene; Prospg, prospermatogonia. Isotype controls as well as single-channel images for DAPI are in Fig. S4. (Magnification: 20×.) (H) DNA methylation histograms of transgenic L1 promoter in prepuberal Mov10l1+/− and Mov10l1−/− testes. Error bars represent SEM between individual sequences. Asterisks indicate statistical difference between two genotypes (Mann–Whitney U test, P < 0.05). The corresponding methylation dot blots are in Fig. S5A. (I) Methylation dot blots of the endogenous promoter in Mov10l1−/− testes at selected time points. The complete dataset is in Fig. S5B. endo, endogenous.

