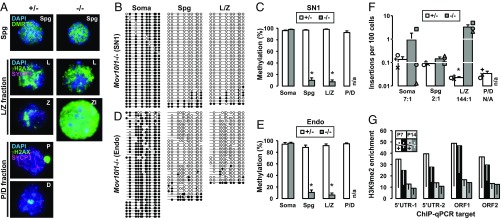
Fig. 4.
Characterization of the single-copy 5′UTR-ORFeus transgene in sorted cell fractions from adult testes. (A) Immunofluorescence analysis of FACS-enriched cells from Mov10l1+/− and Mov10l1−/− testes. Nuclear spreads were labeled with either DMRT6 (green) or γH2AX (green)/SYCP3 (magenta) and counterstained with DAPI (blue). Meiotic prophase I staging was determined based on known labeling patterns of these markers. Representative examples are shown for DMRT6+ Spg, L/Z fraction, and P/D fraction. Zl, zygotene-like spermatocyte in Mov10l1−/− L/Z fraction. All images are at the same scale. (Magnification: 63×.) (B) DNA methylation dot plots of transgenic L1 promoter in sorted cell fractions from Mov10l1−/− testes. (C) Histogram representation of transgenic L1 promoter methylation in both Mov10l1+/− and Mov10l1−/− testes. (D) DNA methylation dot plots of endogenous L1 promoter in sorted cell fractions from Mov10l1−/− testes. (E) Histogram representation of endogenous L1 promoter methylation in both Mov10l1+/− and Mov10l1−/− testes. Error bars in C and E represent SEM between individual sequences. Asterisks indicate statistical difference between two genotypes (Mann–Whitney U test, P < 0.05). The entire dataset of dot plots corresponding to C and E are included in Fig. S7. (F) Insertion frequency of the transgene in sorted cell fractions from Mov10l1+/− and Mov10l1−/− testes. The insertion ratio of Mov10l1−/− to Mov10l1+/− is annotated for each fraction. ddPCR readouts for individual animals are indicated (varied symbols; the same symbol identifies all cell fractions from a specific animal). Error bars represent SEM for biological replicates. Asterisks indicate statistical difference between two genotypes (Student’s t test, P < 0.05). (G) H3K9me2 occupancy at endogenous L1 sequences in prepuberal Mov10l1+/− and Mov10l1−/− testes. Plotted as fold-enrichment over IgG pull-downs for four different regions of the endogenous L1 sequence. Error bars (drawn downward) represent SEM for biological replicates. endo, endogenous; soma, somatic.

