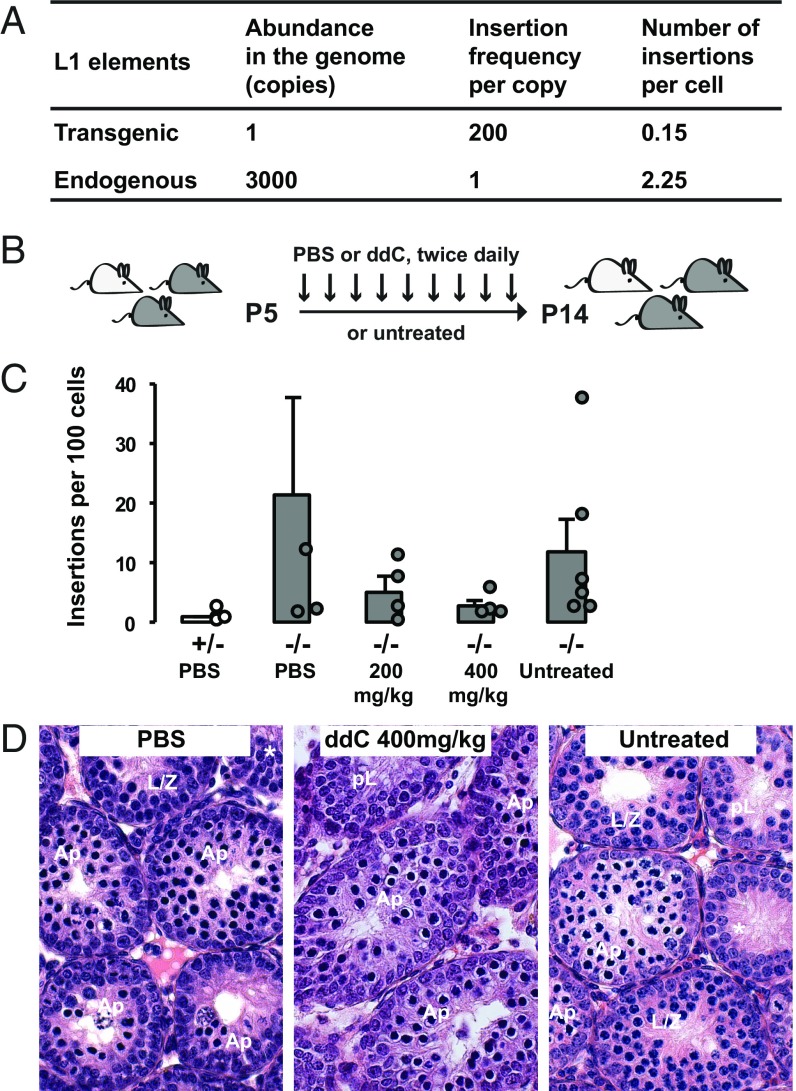
Fig. 5.
Pharmacological inhibition of L1 retrotransposition in Mov10l1−/− mice. (A) Extrapolation of retrotransposition from transgenic to endogenous L1s. See main text for details. (B) Treatment scheme. The litter was treated by intraperitoneal injection of the nursing female twice daily from P5 to P14. (C) Insertion frequency of the transgene in untreated pups and pups treated with PBS or ddC at two different doses. Except for the first column (light gray), all other columns represent data from Mov10l1−/− pups (dark gray). ddPCR readouts for individual animals are indicated (circles) except for one PBS-treated Mov10l1−/− mouse, which had 70 insertions per 100 cells. Error bars represent SEM for biological replicates. Note the average insertion frequency trended downward in ddC treated groups but the difference failed to reach statistical significance (P > 0.05). (D) H&E-stained testicular sections of P14 testes at different treatment conditions. Germ cells of the most advanced stage are labeled for each tubule. Ap, apoptotic spermatocytes; pL, preleptotene. Asterisked tubules lack any discernable spermatocytes. (Magnification: 40×.)

