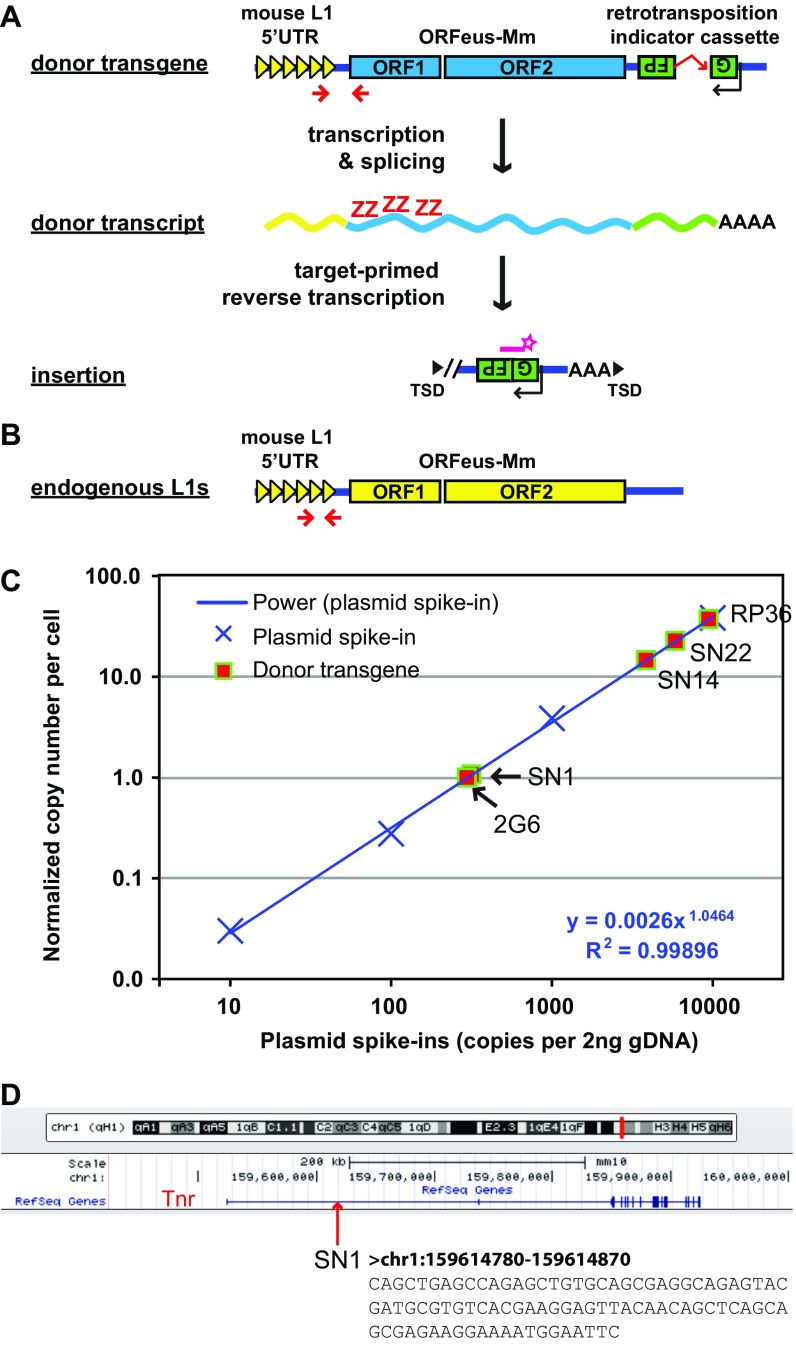
Fig. S1.
Characterization of the 5′UTR-ORFeus transgene. (A) The donor 5′UTR-ORFeus transgene is driven by an endogenous mouse L1 5′UTR promoter. The protein-coding domains ORF1 and ORF2 are derived from the codon-optimized mouse L1 ORFeus-Mm. An introndisrupted EGFP cassette is embedded in the antisense orientation relative to L1 transcription in the 3′UTR of the transgene. The EGFP cassette is flanked by the CMV immediate early promoter and the HSV thymidine kinase polyadenylation signal (both on antisense strand; not depicted). The donor transgene is terminated by the SV40 late polyadenylation signal (not depicted). Methylation status of the transgene promoter is interrogated by a bisulfite primer pair targeting the 5′UTR/ORF1 junction (shown as two converging arrowheads). RNA expression of the transgene is examined in situ by RNAscope with probes specific to the codon-optimized ORF1 sequence (shown as the letter ZZ). Retrotransposition is quantified by ddPCR with a TaqMan probe spanning the splicing junction of EGFP (shown as a starred bar). As depicted, the majority of insertions are 5′ truncated. (B) Location of primers for bisulfite analysis of endogenous mouse L1 promoters. The same forward primer is used for donor transgene but the reverse primer is located in the tether region between 5′UTR monomers and ORF1. Note that this primer pair is expected to amplify both endogenous and transgenic 5′UTRs. However, the signal from the transgene is negligible because of the overwhelming abundance of endogenous sequences. (C) Quantification of the copy number of donor transgenes. Donor transgene copy number was determined by qPCR, as previously described (47), against the human γ-globin intron, which is contained in the EGFP-based retrotransposition indicator cassette and shared by all transgenic lines. Gapdh was amplified in separate wells as an endogenous control. A minimum of three technical replicates was conducted against each target for each sample. The copy number was calibrated to a genomic DNA sample from the mouse line 2G6, which carried a single-copy CAG-ORFeusLSL transgene (24). Genomic DNA spiked with a dilution series of plasmid pRSVGFPuvINT was used to measure qPCR dynamic range and plotted on the x axis. A power regression trendline is shown for the plasmid spike-in series (power). (D) Genomic location of the SN1 transgene. The transgene is positioned in the middle of the 213 kb intron 1 of Tnr. The 3′ flanking genomic sequence is shown.

