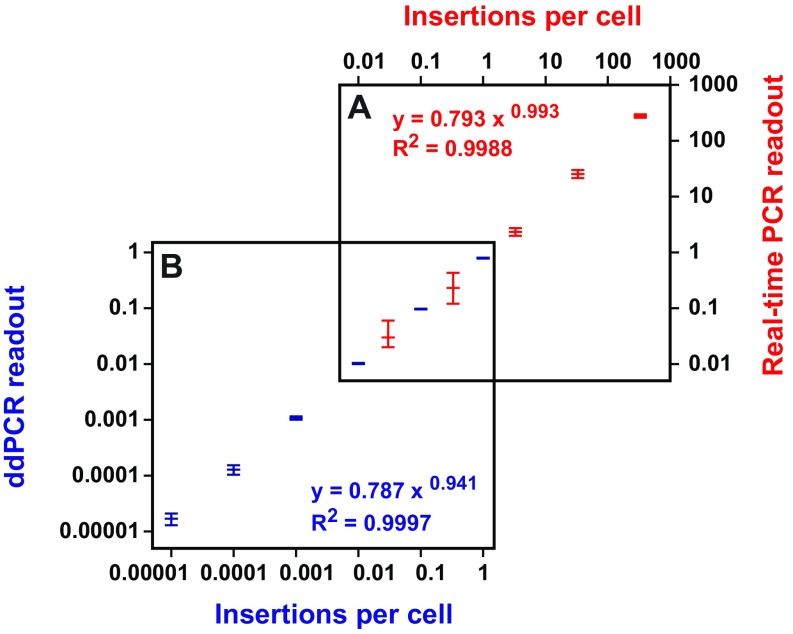
Fig. S3.
Comparison of ddPCR with real-time PCR. (A) Quantification of insertions by real-time PCR. A serially diluted pRSVGFPuvINT plasmid containing intact EGFP (i.e., spliced) was spiked into wild-type mouse genomic DNA and the copy number of plasmid is plotted on the x axis on the top. The TaqMan probe-based real-time PCR readout is plotted on the y axis on the right. The power regression equation and coefficiency of determination (R2) are shown. (B) Quantification of insertions by ddPCR. Mouse genomic DNA containing a germline EGFP insertion was serially diluted into wild-type mouse DNA and the copy number of the insertion in the diluted sample is plotted on the x axis. The TaqMan probe-based ddPCR readout is plotted on the y axis. The power regression equation and coefficiency of determination (R2) are shown.

