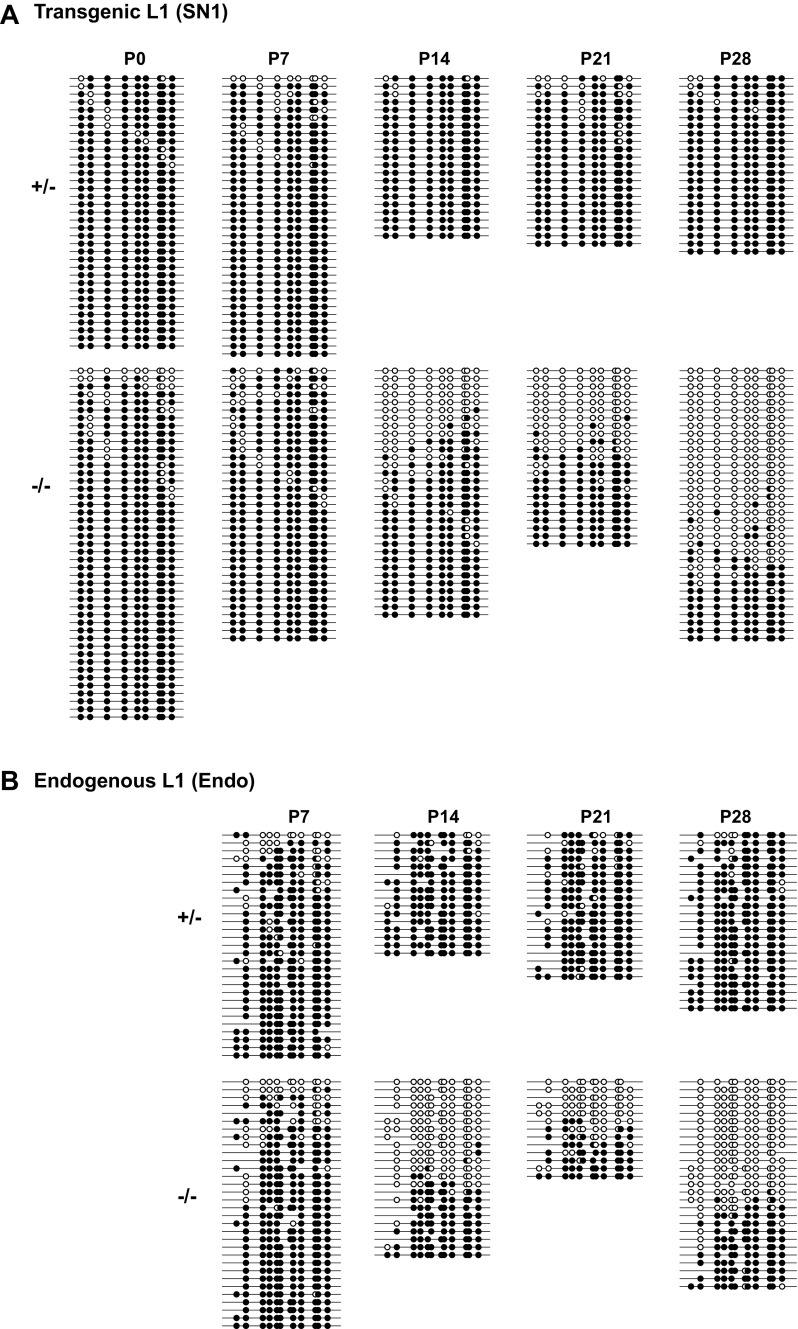
Fig. S5.
The complete DNA methylation dataset for the endogenous and transgenic L1 promoter in prepuberal Mov10l1+/− and Mov10l1−/− testes. (A) Transgenic L1 promoter. The panel corresponds to Fig. 3H. (B) Endogenous L1 promoter. The bisulfite reads were pooled for each genotype/time point from up to three individual animals. The methylation dot plots were generated by QUMA tools. Each row represents one bisulfite PCR amplicon and each column an individual CpG site along the amplified region. The amplicons are arranged from the least to highest methylated. The panel corresponds to Fig. 3I.

