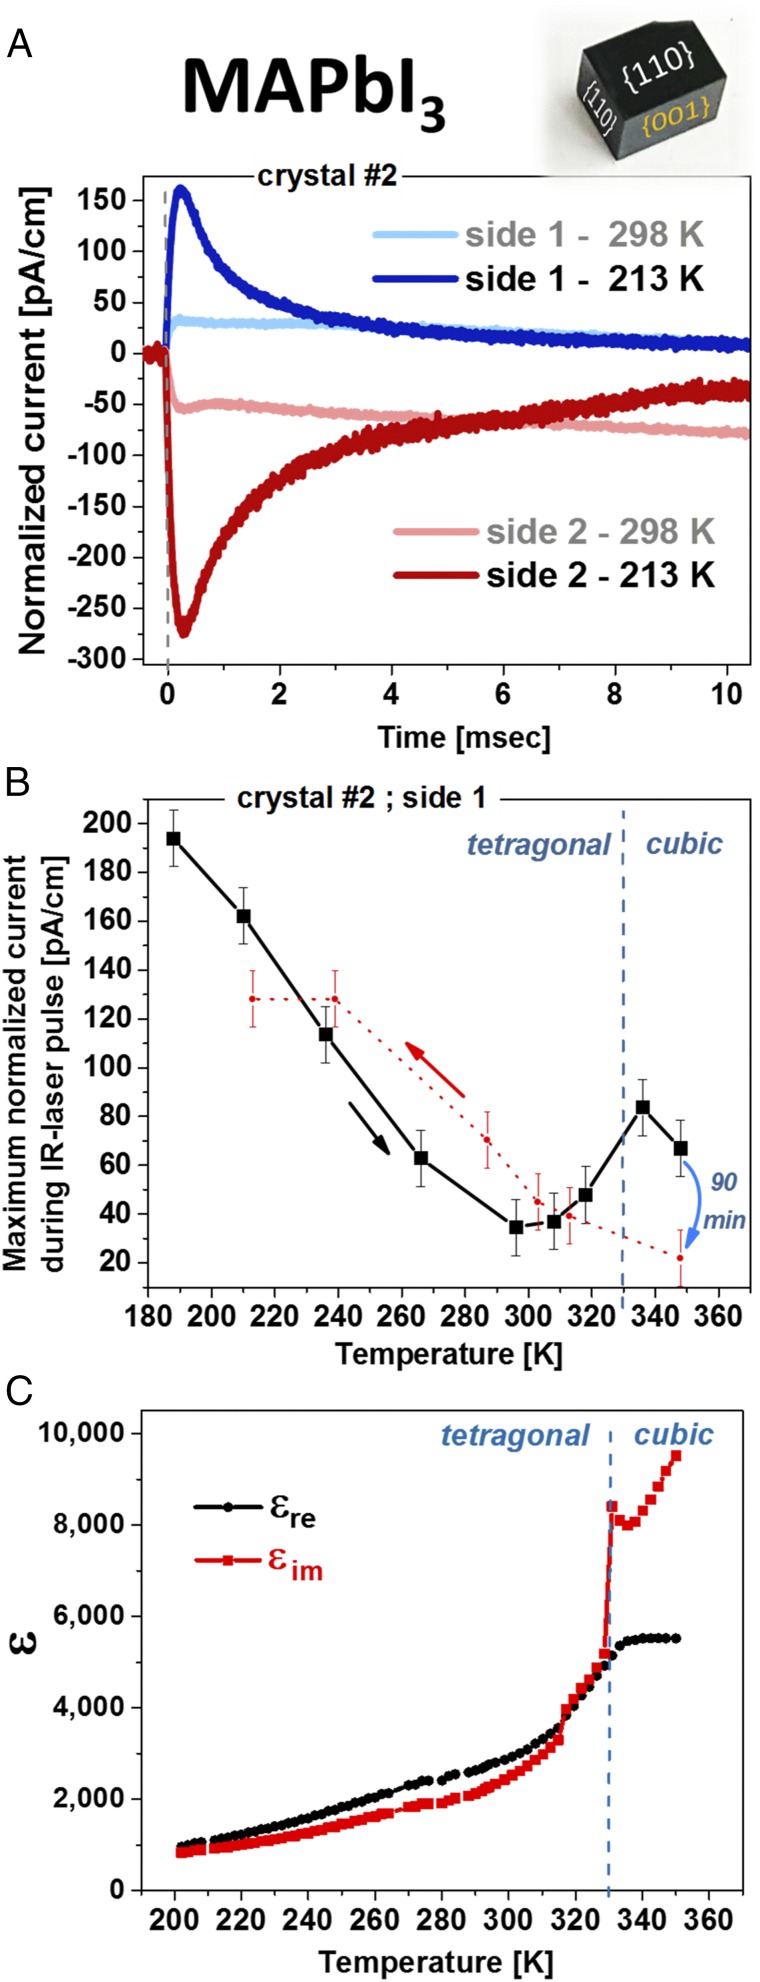
Fig. 2.
Pyroelectric response and relative permittivity measurements. (A) Pyroelectric response at RT (pale-colored plots) and 213 K, LT (deep-colored plots), with contacts on the {001} planes of a MAPbI3 crystal. At RT, the response is convoluted with some thermoelectric currents. Evidence from different crystals can be found in SI Appendix, Fig. S2. (B) Peak-current value dependence on temperature, which shows a TSER that is characteristic for a pyroelectric material (for details, see main text). Evidence for all of the points in the plot can be found in SI Appendix, Fig. S3. (C) The real and imaginary parts of the dependence of the relative permittivity on temperature at 1 kHz (on different crystals than those used for A). The dielectric anomaly at the cubic-tetragonal phase transition is typical for ferroelectric materials.

