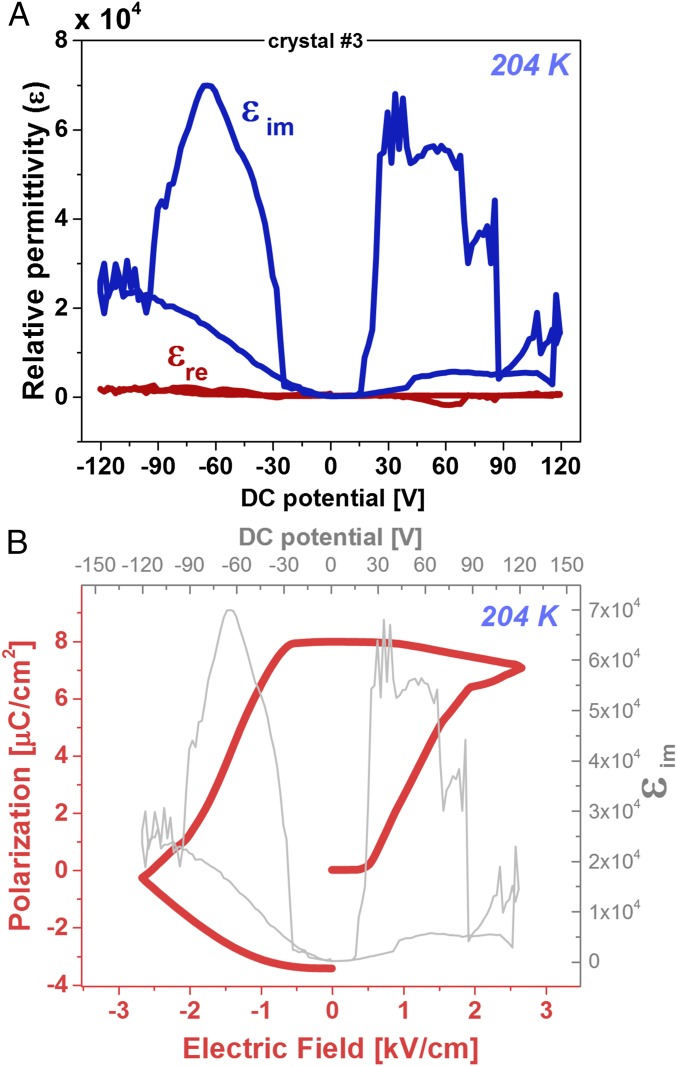
Fig. 3.
Ferroelectric response measurement. (A) Dielectric response at 204 K of a MAPbI3 crystal along its <001> direction, measured at 2,222 Hz and VAC = 0.1 V, as a function of applied bias, EDC (x axis), showing that the imaginary (dissipative) part dominates the dielectric response. (B) P–E hysteresis loop obtained from integration of εim over EDC (Eq. 1). The hysteresis loop is convoluted from a lossy bulk (i.e., resistor) response and ferroelectric polarization response, as illustrated in SI Appendix, Fig. S7A.

