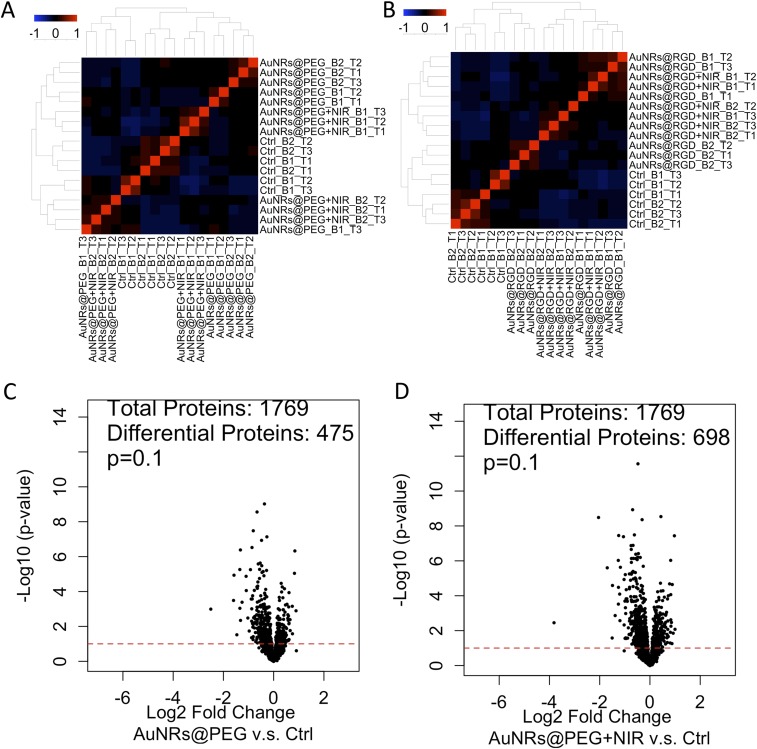
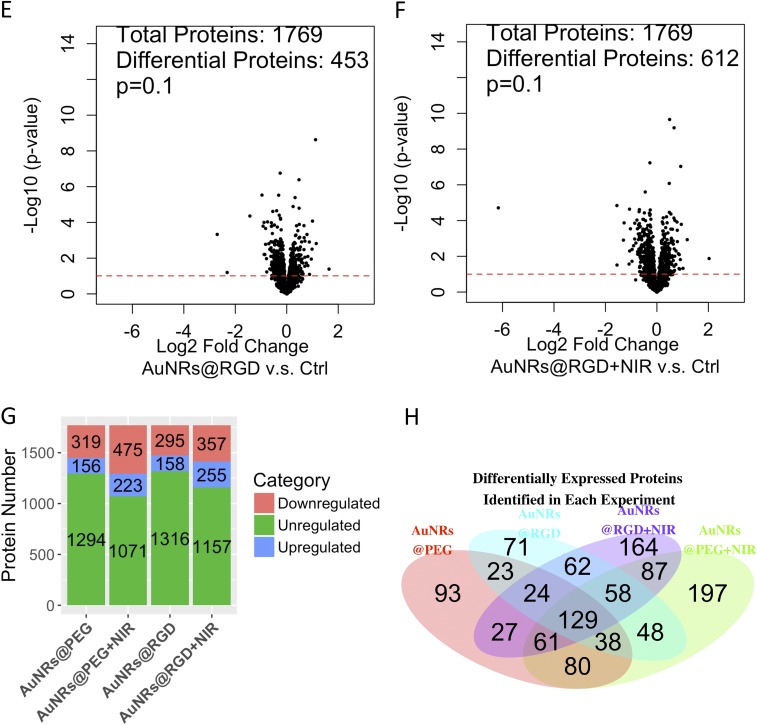
Fig. S5.
Experimental results of proteomics and data analysis. (A) Clustering analysis of samples: AuNRs@PEG, AuNRs@PEG+NIR, and control. (B) Clustering analysis of samples: AuNRs@RGD, AuNRs@RGD+NIR, and control. (C–F) Volcano plots of proteins under perturbation by (C) AuNRs@PEG, (D) AuNRs@PEG+NIR, (E) AuNRs@RGD, and (F) AuNRs@RGD+NIR. (G) Numbers of regulated/unregulated proteins identified in each experiment. (H) Venn diagram showing the comparison of differentially expressed proteins identified in each experiment.


