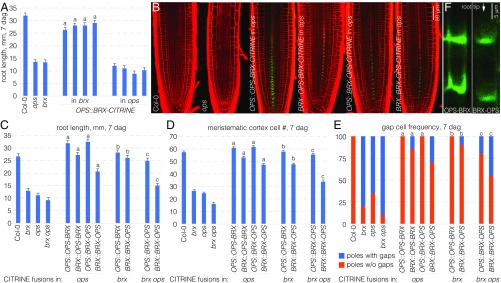
Fig. 7.
Activity and localization of BRX-OPS fusion proteins. (A) Root length of indicated genotypes at 7 dag with four independent transgenic lines per construct (n = 16 per line). Statistically significant differences (Student’s t test) as indicated for P < 0.001 with a = vs. brx; mean ± SEM. (B) Representative confocal microscopy images of PI-stained (red) root meristems for indicated genotypes, expressing fluorescently tagged BRX-OPS fusions (green). (C) Root length of indicated genotypes at 7 dag with representative transgenic lines (n = 15). Statistically significant differences (Student’s t test) as indicated for P < 0.001 with a = vs. ops; b = vs. brx; c = vs. brx ops; mean ± SEM. (D) Meristem size of indicated genotypes at 7 dag with representative transgenic lines (n = 10). Statistically significant differences (Student’s t test) as indicated for P < 0.001 with a = vs. ops; b = vs. brx; c = vs. brx ops; mean ± SEM. (E) Gap-cell frequency of indicated genotypes at 7 dag with representative transgenic lines (n = 20). Statistically significant differences (Fisher’s exact test) as indicated for P < 0.01 with a = vs. ops; b = vs. brx; c = vs. brx ops. (F) Confocal microscopy images of BRX-OPS-CITRINE and OPS-BRX-CITRINE fusion proteins (green), a close-up on developing protophloem sieve elements.

