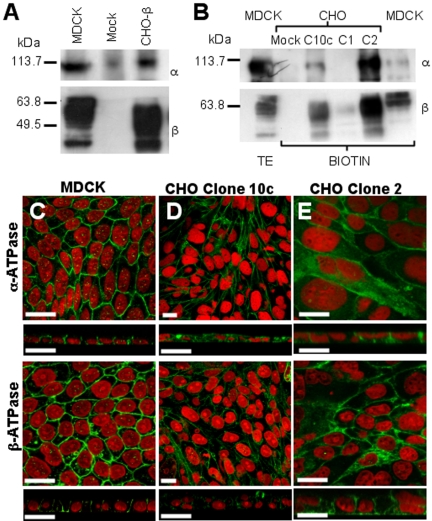
Figure 3.
Expression of α- and β1-subunits in epithelial (MDCK) and fibroblastic CHO cells. (A) Western blots using an antibody against α-subunit (α) and dog β1-subunit (β). As expected, MDCK cells show a heavy mark due to glycosylated β1-subunits. Mock-transfected CHO cells do not show a β1-subunit band, whereas transfected ones (CHO-β) exhibit two bands corresponding to β1-subunits. Blotting with anti-α antibody shows heavy staining in MDCK cells. The antibody crossreacts with the α-subunit of CHO cells. As expected, CHO-β cells exhibit a much heavier staining. (B) Western blots of biotinylated α- and β1-subunits expressed on the cell surface. MDCK lane shows the usual migration pattern of both subunits of total extracts (TE) and cell surface extracts (BIOTIN). Mock-transfected CHO cells show no signal, whereas three different clones of CHO cells transfected with the dog β1-subunit (C10c, C1, and C2) express different levels of the exogenous protein at cell surface. Immunofluorescence confocal images of MDCK (C), 10c clone (D), and clone 2 of CHO-β (E) stained against α- and β-subunits of Na+,K+-ATPase. Each image is accompanied by the transverse section. Nuclei were stained with propidium iodide (red). MDCK cells show the typical chicken fence pattern of both subunits. Transverse sections show the exclusive lateral distribution of the Na+,K+-ATPase. CHO-β clones express the transfected dog β1-subunit as well as the endogenous α-subunit in the plasma membrane. Transverse optical sections below indicate that the Na+,K+-ATPase in CHO-β is not polarized. Bars, 20 μm.

