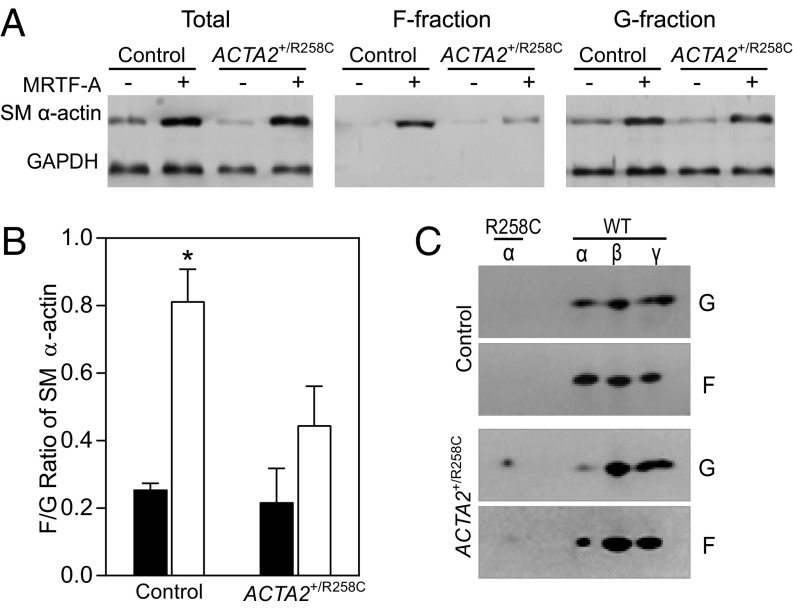
Fig. 7.
Induction of SM α-actin in R258C cells results in decreased F/G actin ratio in comparison with that in control cells. (A) Representative immunoblots showing distribution of SM α-actin in pellet and supernatant fractions. Samples were prepared as described. Pellets (F) were resuspended in volume equal to supernatant (G) and equal volumes loaded for SDS/PAGE and immunoblotting. (B) Quantified effects of SM α-actin variant on F/G SM α-actin ratio. Closed bars, MRTF-A−; open bars, MRTF-A +. n = 3, for three independent cell preparations. *P < 0.01. (C) Representative 2D PAGE and immunoblotting for SM α-actin in F and G fractions from control and R258C cells. n = 3.

