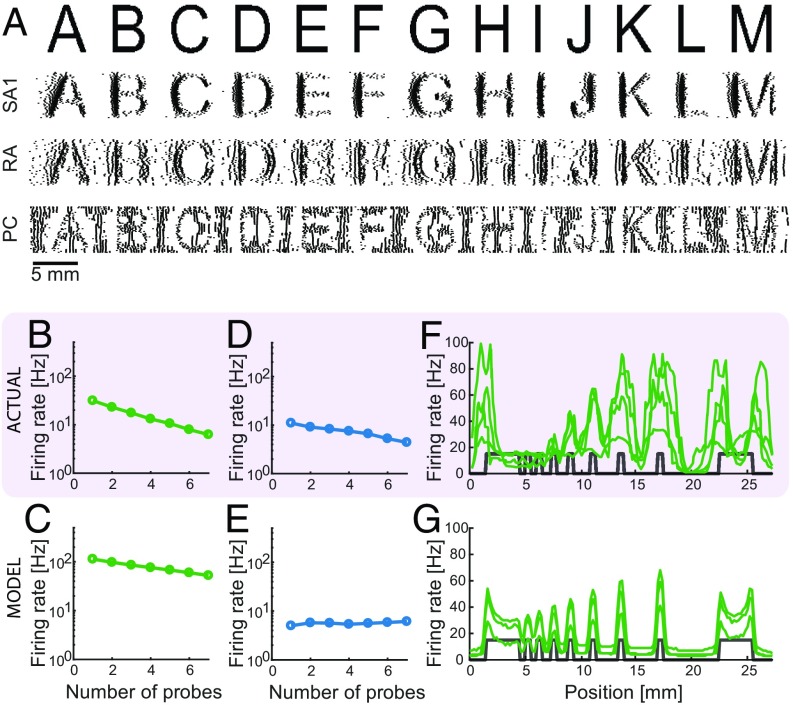
Fig. 4.
Spatial representation. (A) Reconstruction of the SA1, RA, and PC signals for various letters scanned across the skin (4). (B–E) Surround suppression. Average firing rates for (B and D) recorded (34) and (C and E) simulated (B and C) SA1 and (D and E) RA afferents as a function of the number of probes that are contacting the skin. Both recorded and simulated SA1 afferents exhibit stronger surround suppression than their RA counterparts. (F and G) Edge enhancement. Firing rates for (F) recorded (33) and (G) simulated SA1 afferents as function of their location with respect to bar stimuli (shown in gray). Edges of bars evoke higher firing rates for both recorded and simulated afferents.

