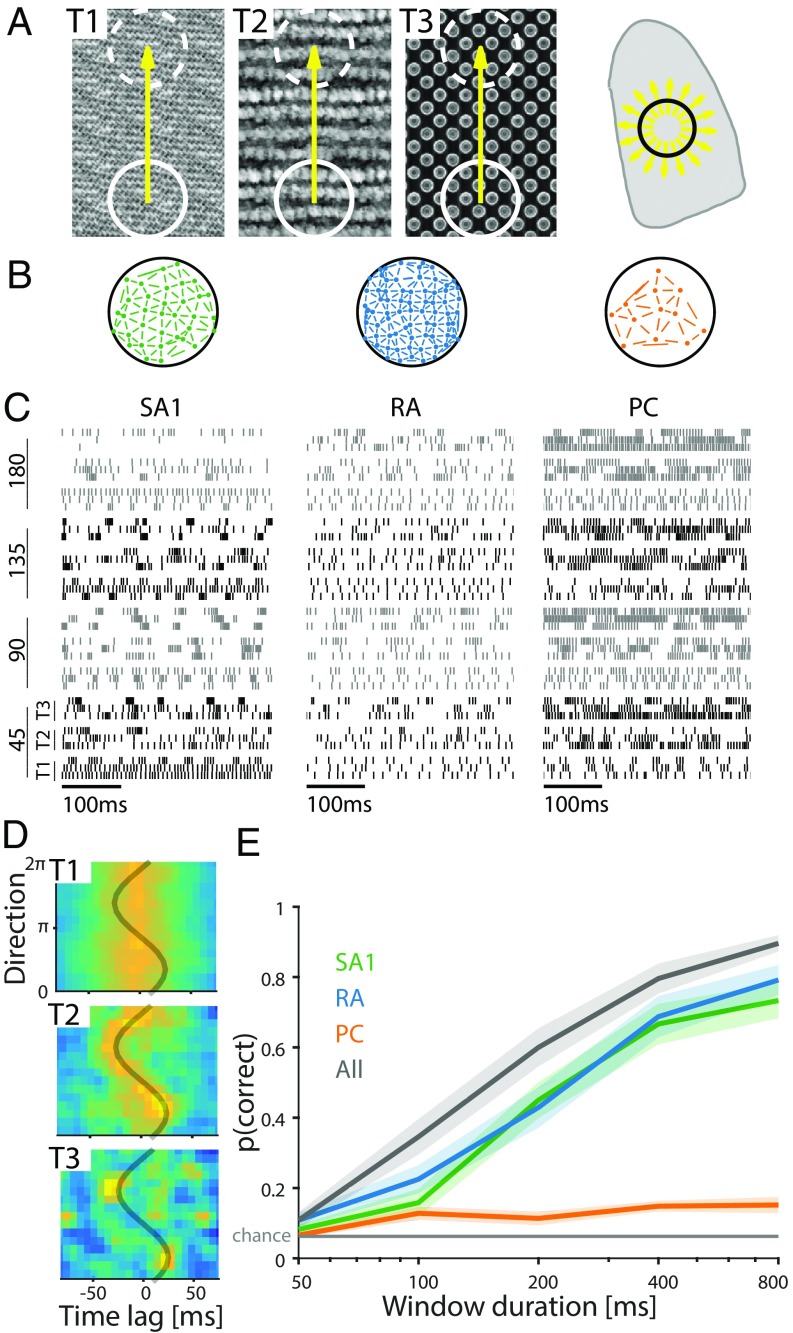
Fig. 7.
Insights from population responses: decoding the direction of textured surfaces scanned across the finger. (A, Left) Three textured surfaces were scanned along the direction indicated by the yellow arrow over a patch of fingertip (denoted by the circle superimposed on the fingertip in A, Right) in 16 directions (shown with arrows on the fingertip). (B) Location of sampled afferents over the contact area for each class. Segments between afferents show pairs selected to compute cross-correlations. (C) Responses of three example afferents to different textures (labeled T1–T3 in A) scanned in four directions (angles on the left are relative to distal direction). (D) Cross-correlogram of a selected RA pair in response to 16 different directions. The gray trace shows the expected peak in the cross-correlogram given a pair of identical neurons responding to a sinusoidal grating. The resulting trace is a cosine with amplitude that is determined by distance between the RFs divided by the stimulus speed and phase that depends on their relative orientation. (E) Performance of the direction classifier (across textures) using correlograms for each afferent type and different window durations. Solid lines denote means, and shaded areas are SEMs.

