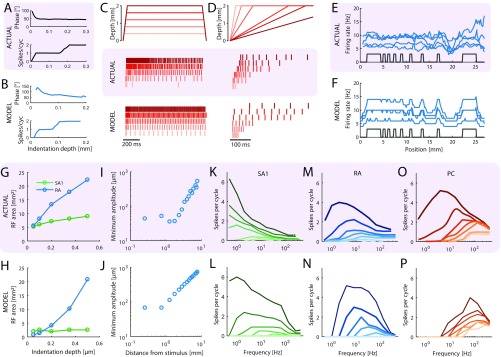
Fig. S4.
Additional response properties. (A and B) Examples of (Upper) phase advance and (Lower) entrainment plateaus exhibited by a (A) recorded and (B) simulated RA afferent at a vibratory frequency of 40 Hz. A was reproduced from ref. 30. (C) Responses of a recorded (75) and modeled SA1 afferent to ramp-and-hold indentations at different depths. (D) Responses of a recorded (26) and modeled RA afferent to different ramp speeds. For both C and D, Top shows the indentation depth of the probe over time, Middle shows actual responses of afferents recorded in humans, and Bottom shows the responses of simulated afferents. (E and F) Edge enhancement. Firing rates for (E) recorded and (F) simulated RA afferents as a function of their location with respect to bar stimuli (shown in gray). Recorded and simulated RA fibers exhibit little spatial modulation; overall firing rates are also lower than for SA1 afferents. E was reproduced from ref. 33. (G and H) RF size vs. indentation depth for (G) actual and (H) simulated afferents. Although RF sizes are relatively independent of indentation depth for SA1 fibers, those of RA fibers grow with increasing depth, a property also exhibited by simulated afferents. G was reproduced from ref. 29. (I and J) Minimum amplitude required to elicit a response as a function of distance from the RF hot spot for (I) actual and (J) modeled RA afferents. The minimum amplitude begins to rise sharply at about 1 mm distance in both actual and modeled afferents. I was reproduced from ref. 30. (K–P) Mean population response strength for recorded (77) and simulated (K and L) SA1, (M and N) RA, and (O and P) PC afferents to sinusoidal stimulation at different amplitudes and frequencies. The darkest lines correspond to the highest amplitudes used (1 mm peak to peak), and every lighter shade corresponds to a decrease in amplitude by 6 dB, down to –36 dB.

