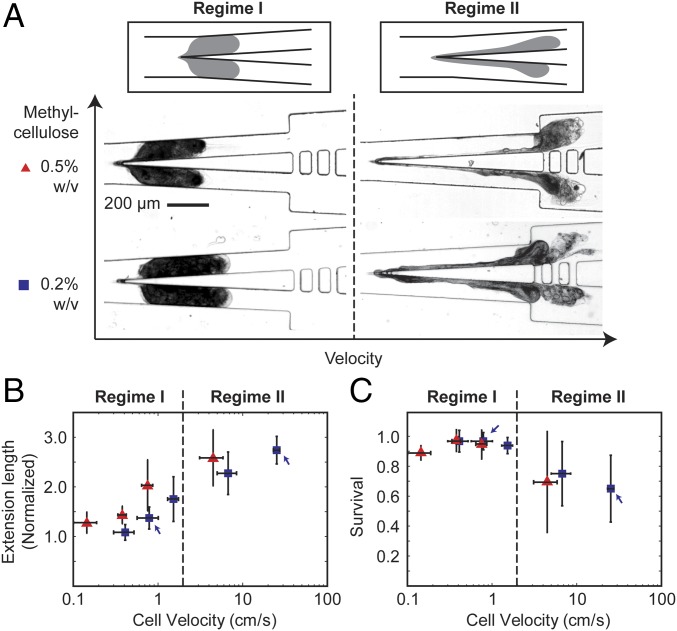
Fig. 2.
Characterization of the effect of applied flow rate on the cutting process and cell survival. (A) Schemes and micrographs showing the morphology of the cell during the cutting process at low velocity (regime I) and high velocity (regime II). For each case, the cells were suspended in a methylcellulose solution at a concentration of 0.2% wt/vol or 0.5% wt/vol. (B) The normalized extension length of the cell during cutting and (C) cell survival rates, as a function of cell velocity measured immediately upstream of the knife. The blue and red symbols correspond to experiments performed in 0.2% and 0.5% methylcellulose solutions, respectively. In B, the markers indicate the mean from 7 cells. In C, the markers indicate the mean from four to seven cells from each of the three separate experiments (or total of >15 cells from all experiments). The height of the error bar represents one SD from the mean. The width of the error bar represents one SD from the mean cell velocity at a fixed flow rate as applied from the syringe pump.

