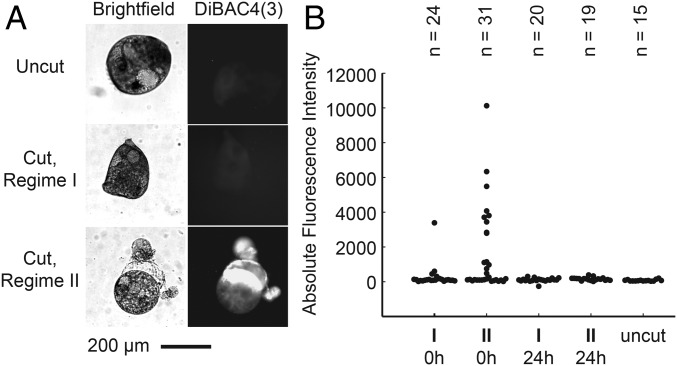
Fig. 3.
Imaging the degree of membrane rupture. (A) Bright-field (Left) and DiBAC4(3) fluorescence (Right) images of uncut Stentor cell, a cell fragment cut in regime I, and a cell fragment cut in regime II, respectively. These cells were cut at the flow conditions indicated by blue arrows in Fig. 2 B and C. (B) DiBAC4(3) fluorescence intensities from cells cut in regime I and in regime II, where DiBAC4(3) was added immediate after the cut (“0h”) or 24 h after the cut (“24h”). The fluorescence intensity of uncut cells is shown as a benchmark. Each marker represents the data for one cell.

