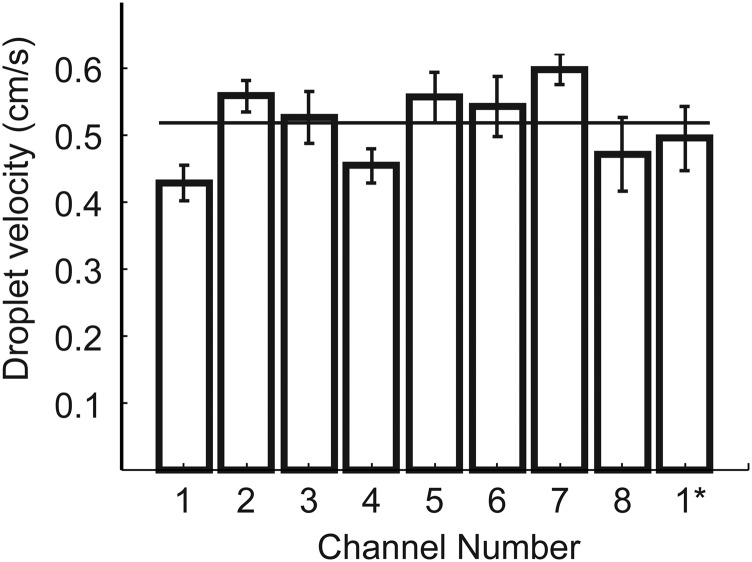
Fig. S4.
Droplet velocity in the eight channels in the parallel microfluidic guillotine device. 1* represents a second measurement of the velocity of drops in channel 1 ∼30 min after the first measurement. The horizontal line represents the mean velocity of droplets in the eight channels. Droplet velocities were calculated using custom MATLAB scripts to track the velocities of drops in videos taken of each channel.

