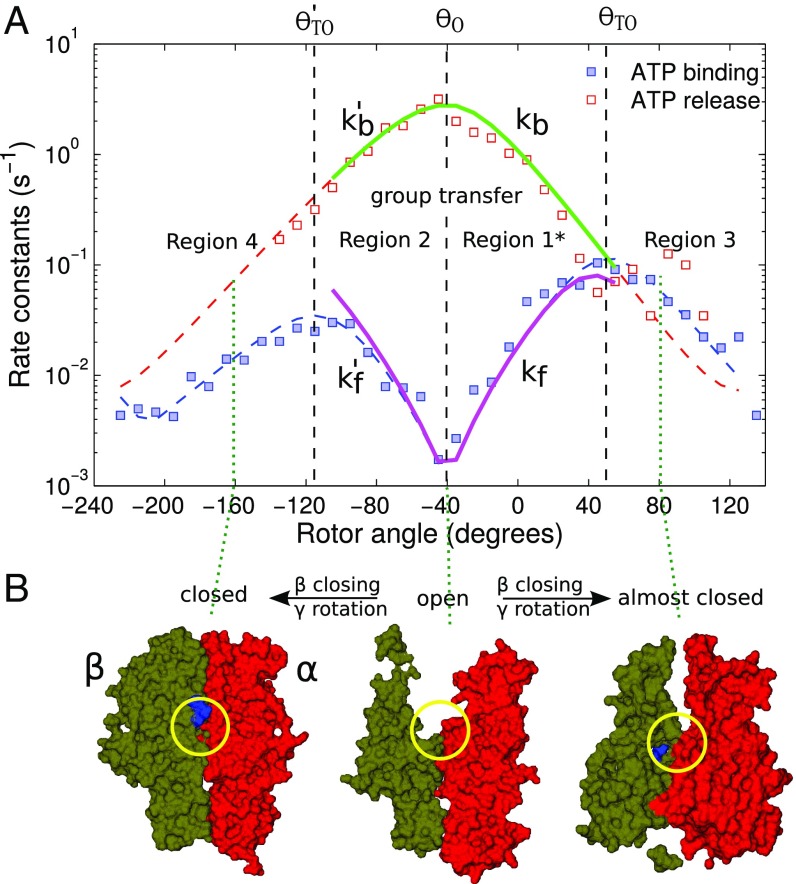
Fig. 2.
Angular dependence of rate constants reported in controlled rotation experiments (A) and corresponding structural changes of the nucleotide binding host subunit at the cited rotor angle (dotted lines; B). Red open and blue filled symbols in A are data points for binding and release processes for ATP at 25-nM concentration monitored in experiments to which dashed lines of matching colors were fitted as guides. Solid lines are the theoretically predicted rate constants, taking into account effects such as missed events and using the total time T instead of the time in the empty state T0.

