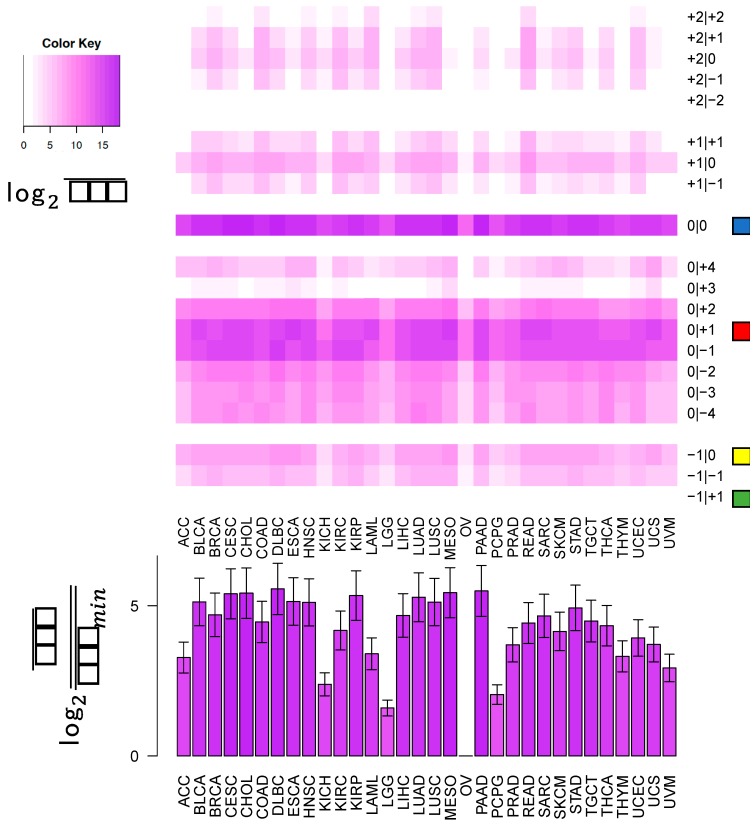
Figure 1.
Heatmap of short RNA-seq mean RPM values across 32 TCGA projects. To assess the level of miR-21-5p isomiRs that are closely related to hsa-miR-21-5p 0|0, we calculated the mean abundance of n = 20 isomiRs across n = 32 TCGA projects. The mean was calculated using all sample types available in each project (specifically: tumor, normal, blood based, or metastasis). We plot a heatmap, where the intensity of purple in each cell represents the log2 mean RPM for that isomiR in that cancer. isomiRs are labeled by the color with which we denote them in later experiments (right). The lower panel shows the log2 fold difference between the level of hsa-miR-21-5p 0|0 in each TCGA project versus the absolute minimum mean observed in ovarian cancer (OV) (mean RPM = 6382.92). Errors bars show propagated formula for the Standard Error of the Mean.

