Figure 3.

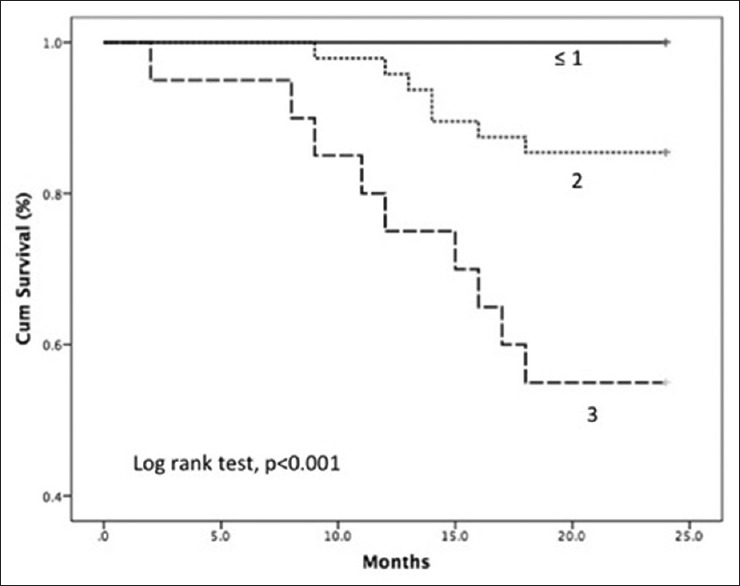
Kaplan–Meier curves with Log-rank statistics showing survival in patients with ≤1, 2, and 3 components of malnutrition inflammation atherosclerosis syndrome

Kaplan–Meier curves with Log-rank statistics showing survival in patients with ≤1, 2, and 3 components of malnutrition inflammation atherosclerosis syndrome