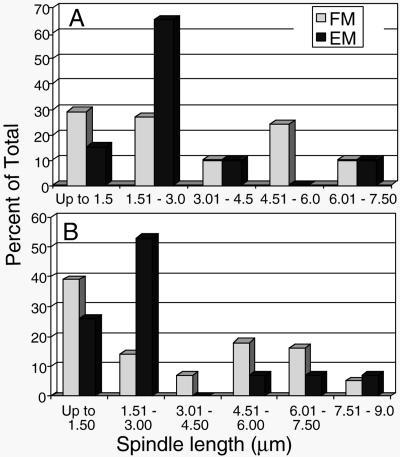
Figure 2.
Meiotic spindle length distribution from fluorescent microscopy (FM) images of cells with GFP-tagged Tub1p compared with those from 3-D reconstruction from EMs. The spindle lengths were determined as described in Materials and Methods and are reported in 1.5-μm bins. The spindle lengths are reported separately for MI (A) and MII (B) and are reported as percent of total number of spindles. The number of spindles in the data set includes 41 MI spindles and 56 MII spindles identified by immunofluorescence microscopy, and 20 MI spindles and 15 MII spindles identified by electron microscopy (see Table 1).

