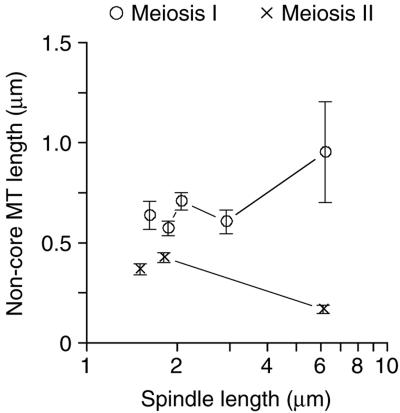
Figure 8.
Apparent kinetochore microtubules diminish in length as MII proceeds indicating anaphase A movements. Plotting the mean length of noncore spindle microtubules in different spindle length classes versus spindle length shows that these microtubules shorten during MII (×), but not during MI (○). This analysis can be biased by a population of stable noncore microtubules, or by the loss (below detection) of microtubules from the spindle models (see text). Error bars represent 74% confidence interval.

