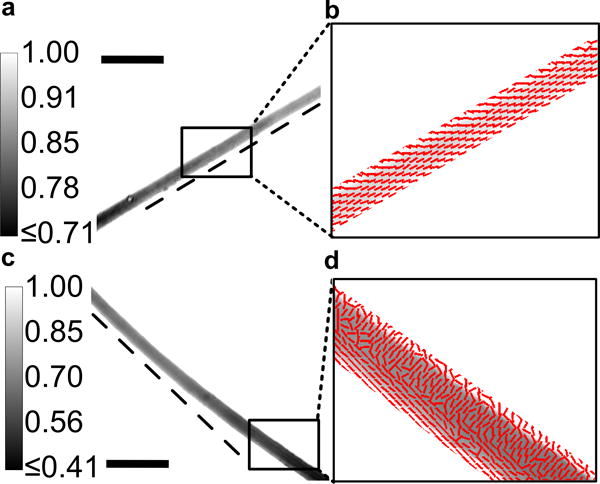
Figure 5.

a) Computed transmittance Image of a a–b) straight vs c–d) bent crystal. Calibration bar in (a,c) shows the range of transmittance. Dark regions (with low transmittance) follow the crystal with the dotted tangential line from one edge of the crystal confirming the curvature in the crystal. Azimuth – polarization orientation of maximum transmittance overlayed on the transmittance image indicating unidirectional axes in the b) straight crystal while in the d) bent crystal, there is a bidirectional axes depending on the direction of compressional (inward bending edge leads to an orthogonal axes) or tensile stress (outward bending edge leading to a longitudinal axis). Scale bar in a,b = 100 μm.
