
Figure 2.
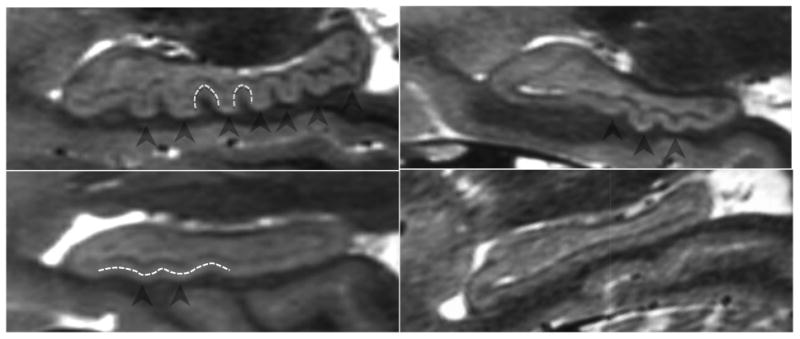
Examples of variation in degree of dentation among healthy adults. A depicts a high degree of dentation with many prominent, or arciform dentes. B depicts few arciform dentes. C shows few, less prominent, or sinusoidal dentes. D shows a hippocampus with no apparent dentation. Arrowheads indicate individual dentes. Dashed white lines illustrate the contour of arciform (A) and sinusoidal (C) dentation.