Figure 2.

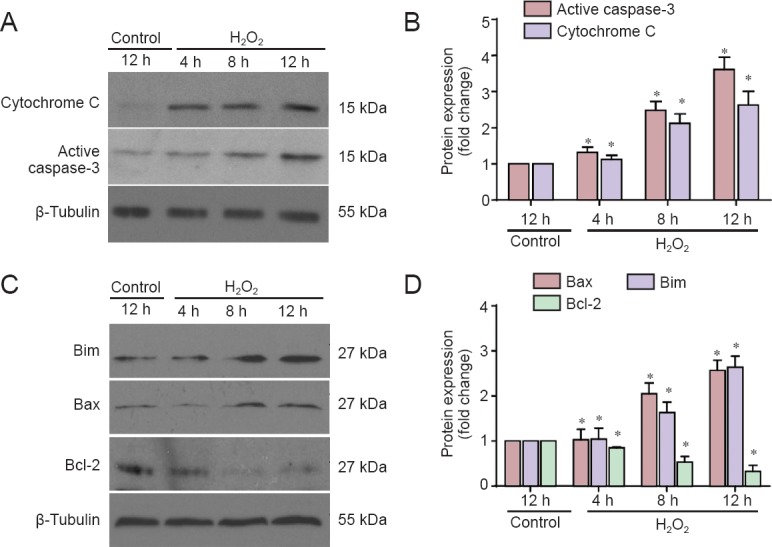
H2O2 treatment altered protein expression in cerebellar granule cells.
(A, C) Western blots for cytochrome c and active caspase-3 (cleaved caspase-3), Bim, Bax, Bcl-2. Cell lysates were subjected to western blotting with antibodies against cytochrome c and active caspase-3 (A) or Bim, Bax, and Bcl-2 (C). (B, D) Quantified grayscale intensities of the bands (A, C), relative to the β-tubulin band in the control group. Data are expressed as the mean ± SEM (n = 4, analysis of variance and Student-Newman-Keuls post hoc test). *P < 0.05, vs. control. h: Hours.
