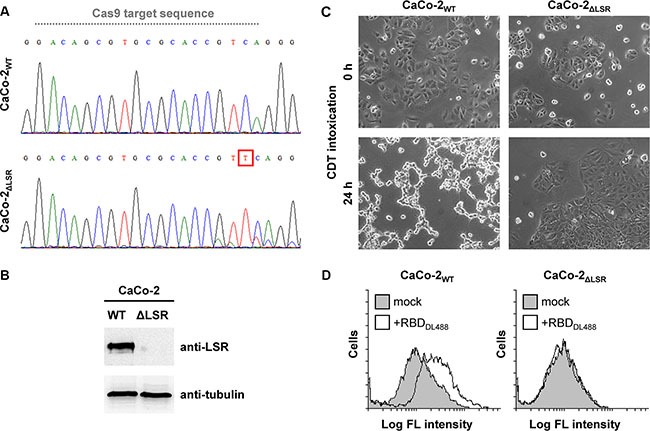
Figure 1. Evaluation of the CRISPR/Cas9-generated CaCo-2 LSR knockout cells.

(A) DNA sequencing chromatograms for CaCo-2WT and CaCo-2ΔLSR cells covering a sequence within exon 2 of the LSR gene. Grey dotted line indicates the Cas9 target sequence. A red box highlights the base pair insertion (thymine) in exon 2 of the LSR gene from CaCo-2ΔLSR cells. (B) LSR immunoblot with whole-cell lysates from CaCo-2WT (WT) and CaCo-2ΔLSR (ΔLSR) cells (top panel). Equal loading of samples was verified by detecting tubulin with a specific antibody (bottom panel). (C) Intoxication of CaCo-2WT and CaCo-2ΔLSR cells with CDT. Microscopic images were taken at indicated time points after toxin addition. (D) Suspensions of CaCo-2WT and CaCo-2ΔLSR cells were incubated with the receptor-binding domain of CDT labeled with DyLight488 (RBDDL488) or were left untreated (mock) prior to FACS analysis. FACS results are presented as histogram plots and single cell events (cells) are plotted against the intensity of cell-surface bound fluorescence (Log FL intensity). White peaks indicate the fluorescence distribution of cells incubated with RBDDL488 and grey peaks represent mock-treated cells with no addition of fluorescence-labeled protein.
