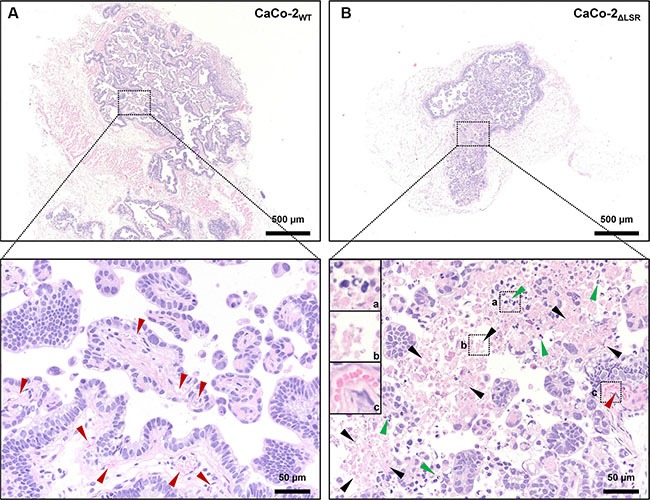
Figure 3. Histology of CaCo-2WT and CaCo-2ΔLSR xenograft tumors.

The panels show Hematoxylin and Eosin (H&E) stainings of representative sections of (A) CaCo-2WT and (B) CaCo-2ΔLSR tumors. Upper panels illustrate the difference of the xenograft tumor size (larger tumor in (A)). Lower panels show enlargements from upper panels (dotted boxes), with marked blood vessels in an accompanying stromal component (red arrows) in CaCo-2WT (left) and marked apoptosis with karyorrhexis and intact plasma membrane (green arrows) as well as necrosis with karyorrhexis, karyolysis and disrupted plasma membrane (black arrows) in CaCo-2ΔLSR (right) xenograft tumors.
