
Figure 2. Establishment of stable overexpression of hMAGEA2 in TNBC cell lines.
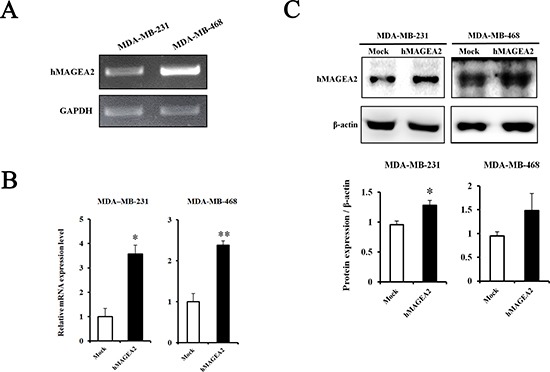
(A) The level of endogenous expression of hMAGEA2 in MDA-MB-231 and MDA-MB-468 cell lines assessed using RT-PCR. (B) Relative mRNA expression of stably overexpressed hMAGEA2 in MDA-MB-231 and MDA-MB-468 cell lines; β-actin was used as normalization control. (C) Protein expression of stable hMAGEA2 overexpression in MDA-MB-231 and MDA-MB-468 cell lines; β-actin was used as loading control. (Means ± SD, *p < 0.05, **p < 0.01, compared with control).