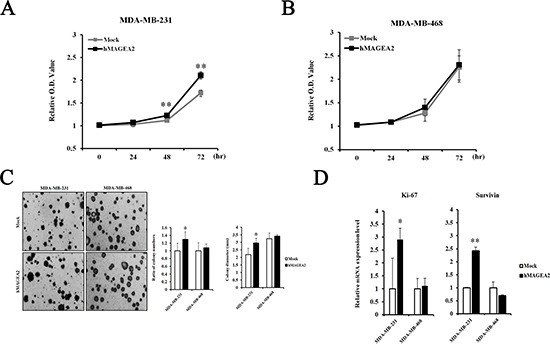
Figure 3. hMAGEA2 enhances proliferation capacity and anchorage-independent colony formation in TNBC cell lines.

(A) Relative optical density (O.D.) values of MDA-MB-231 cell line overexpressing hMAGEA2 were compared with those not overexpressing hMAGEA2 using the CCK-8 assay. O.D. was measured after 0, 24, 48, and 72 h. (B) Relative O.D. values of MDA-MB-468 cell line overexpressing hMAGEA2 were compared with those not overexpressing hMAGEA2. O.D. values were measured after 0, 24, 48, and 72 h. (C) Representative images of colonies were acquired using microscopy (x50 magnification, scale bar = 250 μm) (left panel) Colony numbers were counted in MDA-MB-231 and MDA-MB-468 cells lines overexpressing hMAGEA2 and those not overexpressing hMAGEA2. Colony diameters were compared in MDA-MB-231 and MDA-MB-468 cell lines stably overexpressing hMAGEA2 and those not overexpressing hMAGEA2. (right panel) (Means ± SD, *p < 0.05, compared with control) (D) Relative expression of Ki-67 and survivin mRNA was compared between MDA-MB-231 and MDA-MB-468 cell lines overexpressing hMAGEA2 and those not overexpressing hMAGEA2. (Means ± SD, *p < 0.05, **p < 0.01, compared with control).
