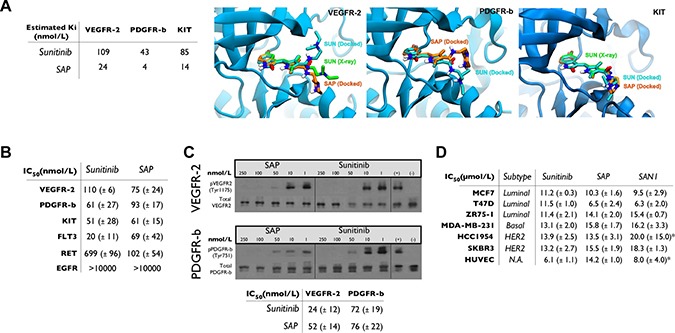
Figure 2. In silico and in vitro analysis of SAP.

(A) Docking results for SAP and sunitinib. Molecular models of the ATP-binding site of VEGFR-2, PDGFR-β and KIT illustrating the predicted bound poses of sunitinib (SUN, cyan sticks) and SAP (orange sticks) in comparison with the crystallographic conformation of sunitinib (SUN, green sticks) of VEGFR2 and KIT. (B) Summary of in vitro kinase activity in multiple RTKs in the presence of sunitinib or SAP (± SD). (C) Cell based autophosphorylation assay for VEGFR-2 and PDGFR-β in the presence of sunitinib or SAP (± SD). (D) MTT cytotoxicity assay in a panel of BrCa cell lines and HUVEC. *historical data. N.A: Not Active.
