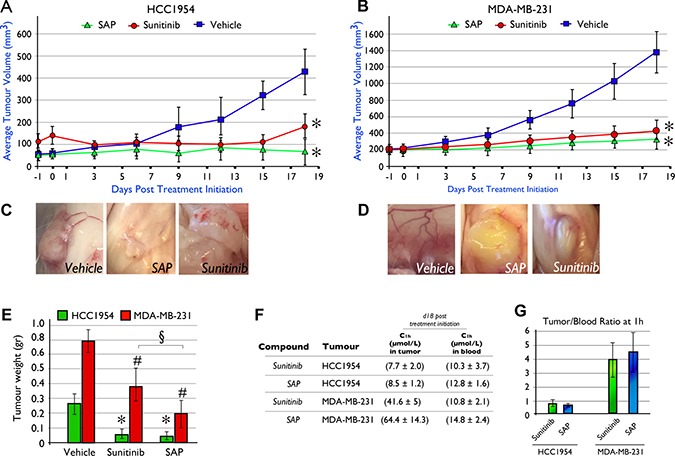
Figure 4.

In vivo efficacy of SAP (100 μmol/Kg) versus equimolar amounts of sunitinib in NOD/SCID mice xenografted with (A) HCC1954 and (B) MDA-MB-231 cell lines. Mice were dosed (IP) daily with SAP, sunitinib or vehicle. Each point represents the mean of at least 10 tumor volumes resulting from at least five mice ± SD. * P < .001, compared with the vehicle group by using one way ANOVA followed by the post hoc Turkey-Kramer multiple comparison test (C) Evidence of reduced neo-angiogenesis in HCC1954 and (D) MDA-MB-231 xenografted tumors from SAP and sunitinib compared to vehicle treated mice. (E) Average tumor weight at day of sacrifice (d18) between treatment groups. Each bar is the average of 10 tumors for each treatment ± SD. The *for the HCC1954 and #for the MDA-MB-231 cell line denote a P < .001, compared with their respective vehicle group while the § denotes a P < .001 between SAP and sunitinib, by using one way ANOVA followed by the post hoc Turkey-Kramer multiple comparison test. (F) Average intratumoral and blood drug levels as measured by LC-MS/MS at 1h post a final dose on d18 (± SD). (G) Tumor/blood (t/b) ratio for SAP and sunitinib from the LC-MS/MS measurements.
