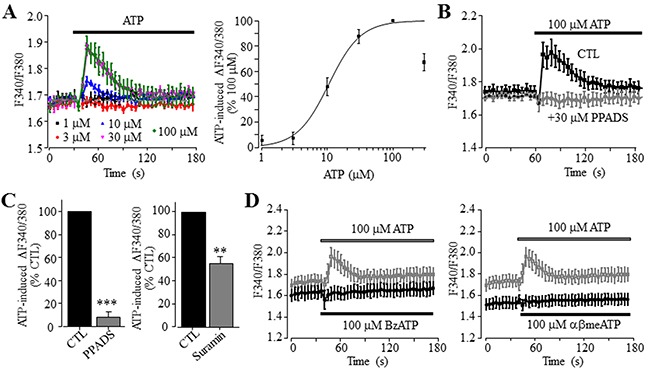
Figure 1. ATP induces concentration-dependent increase in the [Ca2+]i in Huh-7 cells.

(A) Left, representative recordings of Ca2+ responses induced by 1-100 μM ATP, with six wells of cells for each concentration. Right, ATP concentration-peak Ca2+ response curve, constructed by expressing the responses induced by 1-300 μM ATP as % of that induced by 100 μM ATP. Each data point represents three independent experiments. The smooth line represents the least squared fit to Hill equation with EC50 and Hill coefficient of 11 μM ATP and 1.8, respectively. (B) Representative recordings of Ca2+ responses induced by 100 μM ATP, in control cells or cells pre-treated with 30 μM μM PPADS, with six wells of cells for each case. (C) Summary of ATP-induced peak increase in the [Ca2+]i in control and cells treated with indicated concentrations of 30 μM PPADS (left panel) and 30 μM suramin (right panel), expressed as % of that in control cells, from three independent experiments. **, p < 0.01; ***, p < 0.001. (D) Representative recordings of Ca2+ responses induced by 100 μM BzATP (left panel) or 100 μM αβmeATP (right panel) and 100 μM ATP (in grey), with six wells of cells for each case. Such results were observed in three independent experiments.
