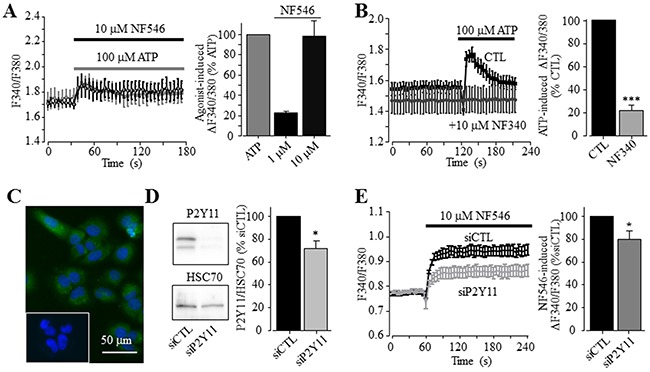
Figure 3. A key role of the P2Y11 receptor in ATP-induced increase in the [Ca2+]i in Huh-7 cells.

(A) Left, representative recordings of Ca2+ responses induced by 10 μM NF546 (black) and 100 μM ATP (grey) in the extracellular Ca2+-containing solution with six wells of cells for each case. Right, summary of the peak increase in the [Ca2+]i induced by 1 and 10 μM NF546, expressed as % of that induced by 100 μM ATP, from three independent experiments. (B) Left, representative recordings of Ca2+ responses induced by 100 μM ATP in control cells or cells pre-treated with 10 μM NF340, with six wells of cells for each case. Right, summary of ATP-induced peak increases in the [Ca2+]i in control or NF340- treated cells, expressed as % of that in control cells, from three independent experiments. ***, p < 0.001. (C) Representative confocal images showing P2Y11 immunostaining. Cells were countstained with DAPI. The insert shows control cells stained only with the secondary antibody. Similar results were observed in two independent experiments. (D) Left, representative western blot analysing P2Y11 receptor expression in cells transfected with control and P2Y11-specific siRNA (siCTL and siP2Y11). Right, summary of mean P2Y11 protein expression, normalized to the HSC70 protein level and presented as % of the value in cells transfected with siCTL, from six independent experiments. *, p < 0.05. (E) Left, representative recordings of Ca2+ responses induced by 10 μM NF546 in cells transfected with indicate siRNA, with 4 wells of cells for each case. Right, summary of ATP-induced peak increases in the [Ca2+]i in cells transfected with siCTL and siP2Y11, expressed as % of that in cells transfected with siCTL, from six independent experiments.
