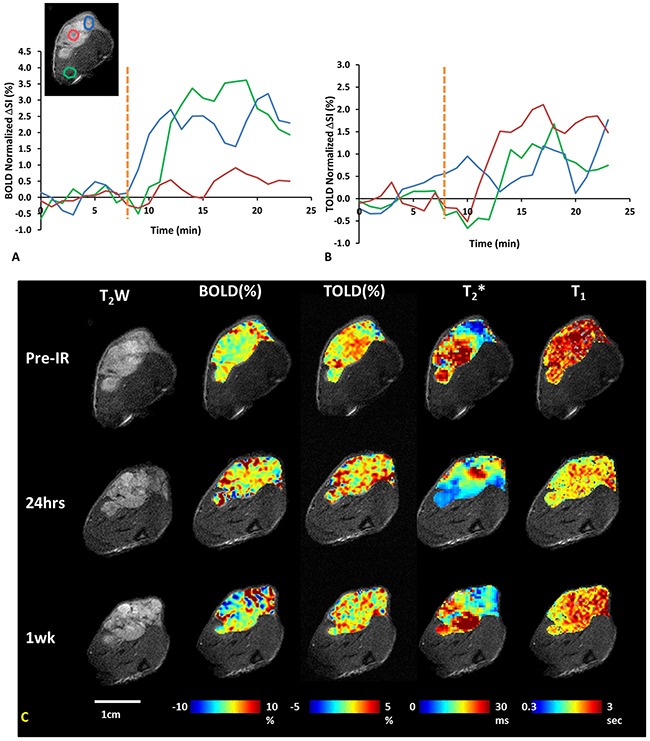
Figure 2. Oxygen sensitive MRI of a representative A549 lung tumor with respect to irradiation.

(A) ΔSI curves showing BOLD, and (B) TOLD responses for three ROIs indicated on T2w-image (blue tumor periphery, red tumor center and green adjacent muscle). Yellow dotted line indicates transition from air to oxygen breathing. (C) T2w-images and overlaid parametric maps showing %ΔSI of BOLD and TOLD, T2* and T1 maps (left to right) of tumor (0.5 cm3) before, 24 hours and one week after 1st dose of radiation (12 Gy).
