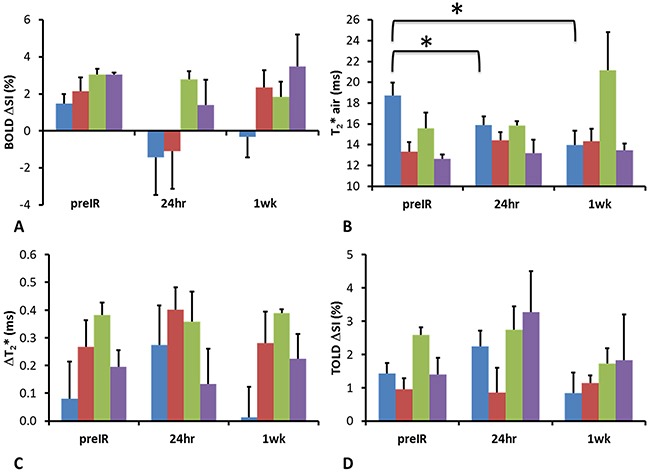
Figure 4. Summary of changes of oxygen sensitive parameters for irradiated group.

Graphs showing mean and standard errors of the mean pre IR, 24 hours and 1 week post radiation for tumors and adjacent muscle of the irradiated (n = 9 for preIR and 24 hours; n = 6 for 1 week) and control rats (n = 3). Irradiated tumor (blue), adjacent muscle (red) control tumor (green) and muscle (purple).* p<0.05 based on paired t-test.
