
Figure 5. DCE parametric maps of the representative tumor pre, 24 hours and 1 week after first dose of radiation treatment.
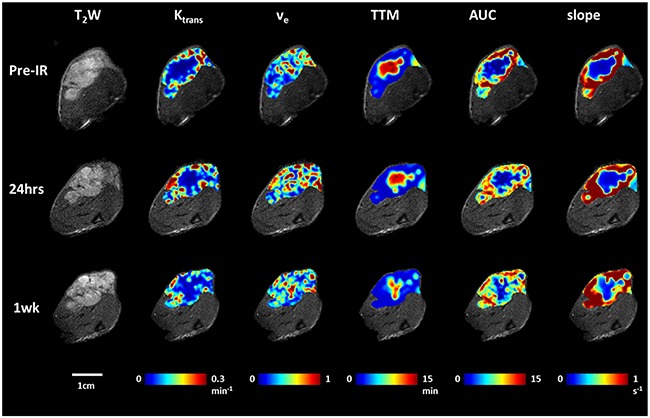
T2-weighted images and overlaid parametric response maps showing, Ktrans, ve, TTM, AUC and slope (left to right) of the same tumor as Figure 2 pre, 24 hours and one week after first radiation therapy. Distinct heterogeneity is observed for all the maps. No obvious changes were observed following radiation compared to baseline.